JSE & Global markets digest for the last week of August 2026

Although the last week of the month is typically considered a key week for stock markets, filled with corporate reports, this didn't impact the volatility of index stocks, the indices themselves, or currency pairs. So the week turned out to be calm and stable for the market as a whole, but not for individual stockholders, as, of course, among the hundreds of companies, there were some that posted outstanding rallies and published financial reports, which didn't always reflect well on stocks.
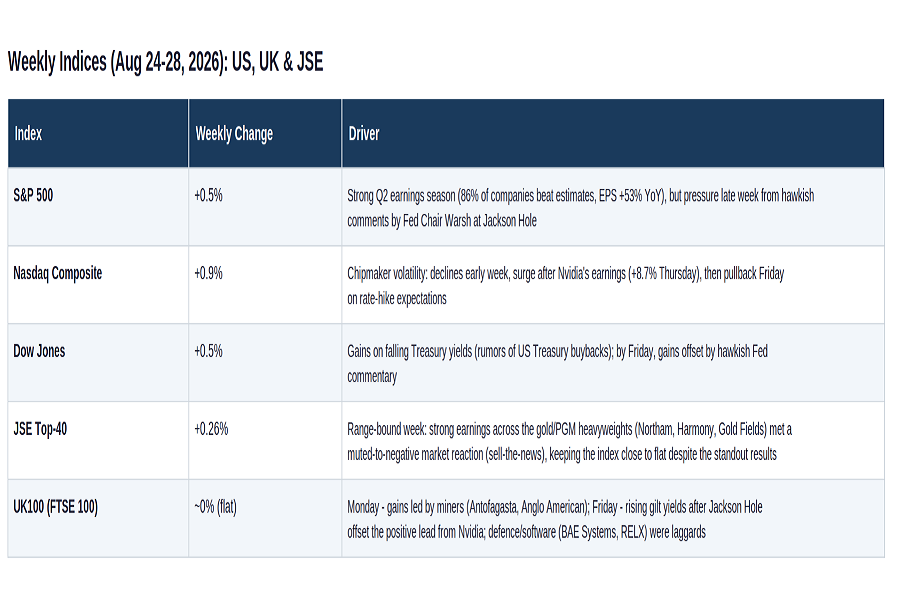
Indices for August 24-28
The table shows that the indices seem to have frozen, holding at their maximum values. Let's review each market in details
South African stock market on the last week of August 2026
In the last week of August, the JSE saw mostly strong corporate earnings, particularly in the gold and platinum sector (Northam, Harmony Gold, and Gold Fields posted multiple profit increases and record dividends). However, this didn't translate into a wave of buying. Moreover, we had a dramatic story with Labat Africa (JSE: LAB) whose stocks has been suspended from listing on JSE due to they failed to pay declared dividends.
The market reaction was mixed or downright muted: Harmony Gold (JSE: HAR) shares fell approximately 14% despite record profits, and the reaction to Gold Fields' report was, according to analysts, "muted". The only truly strong surge in the sector – Northam Platinum was caused not by the earnings report, but by the unexpected news of a possible takeover by Valterra Platinum, which triggered a competitive auction for the company.
At the same time, there were also weak reports (Mpact, Truworths, Italtile, Blu Label), which further explains why the indices remained virtually unchanged over the week: the market as a whole was weighing strong fundamentals against already-built expectations and isolated disappointments, rather than demonstrating uniform optimism.
Nevertheless, we admit an impressive rally +32% of the Insimbi Industrial Holdings (JSE: ISB). Manufacturer of foundry and refractory materials issued trading statement according to which they declared turnback to the profit and develop by all metrics. For a small-cap it was enough to add +32% to the stock price.
Mining companies in general pleased investors with strong reports and times increased dividends. In particular Gold fields (JSE: GFI) reported that Profit for the half-year ending June 30 increased by 81%. The interim dividend jumped 132%,. Most importantly, the company expanded its additional capital return program to $1.25 billion (special dividends and buybacks), having already repurchased $300 million in shares between March and July. 61% of adjusted free cash flow went to shareholders. Unfortunately investors were sceptical regarding mining PGM sector. Stocks added a few % on reports and Harmony Gold Limited despite strong report, decreased by 14% for the week.
US market in August 24-28 overview
All three US indices closed the week higher, but increase is micro and the journey there was turbulent. The start of the week was weighed down by concerns about Iran and weak chip prices, then the market rebounded on Wednesday and Thursday on Nvidia's earnings report, only to cool again by Friday on statements from new Federal Reserve Chairman Kevin Warsh.
Healthcare sector remains the most growing second week in a row.
The most impressive rally was with Prenetics Global Limited (NASDAQ: PRE). A consumer healthcare company founded in 2014 added +47% within a week. Their drivers day by day:
- August 24: Insiders (company management) purchased $3.75 million worth of shares.
- August 26. Article about the CFO's "confident move" boosting confidence in the company.
- August 27. Analyst B. Riley initiated coverage with a "Buy" rating for the first time, plus Benchmark previously raised its target from $30 to $40.
This stock is an exciting story for shareholders given that for the last 12 months it has been added 253% and according to the forcast add +48%.
From NYSE we have another successful company this week. Abercrombie & Fitch, American clothing retailer, added 33% based on report and insider trades. So as it became known, Q2 FY2026 results (the 13 weeks ending August 1) has been published on the morning of August 26, and were a crushing blow to the consensus:
- Adjusted EPS: $4.17 versus analyst expectations of $1.98 - more than double the forecast.
- Revenue: $1.27 billion (a record for Q2), +5% y/y, above expectations of $1.24-1.25 billion – this is the 15th consecutive quarter of sales growth.
- Operating margin: 20% versus the company's own forecast of ~10% – this is the main surprise, not just "beating the consensus."
Short positions accounted for about 9% of the stock's total free float - meaning the crushing earnings report and the raised guidance were compounded by a short squeeze, which explains why the move was so explosive - the stock's largest one-day jump since November 2025. Thus this stock finish August with +47% growth.
UK market for the last week of August 2026
The London Stock Exchange spent the week of August 24–28 in a state of macroeconomic neutrality. The flat performance of the FTSE 100 and FTSE 250 was the result of a combination of a strong pound, which put pressure on exporters, and a lack of strong domestic triggers. However, beneath the calm surface of the indices, the traditional rotation lurked: mining and real estate kept the market from slumping while oil majors came under pressure.
This situation did not prevent the rally of individual companies. McBride (LSE: MCB) plc added in price +24% for the week. The driver was a deal with Vestacy (E.H Group B.V.) is a global home furnishings company that owns the Air Wick, Calgon, Cillit Bang and Mortein brands. According to the deal, McBride buy 2 factories in Portugal and Spain. Two long-term production contracts for a period of 5-8 years.
Also, Sunda Energy PLC stocks were increasing for the week up to +31%, on their purchase of operating mining assets in New Zealand. This stock ends August with +84% increase in value.
Indices technical analysis digest
JSE TOP-40
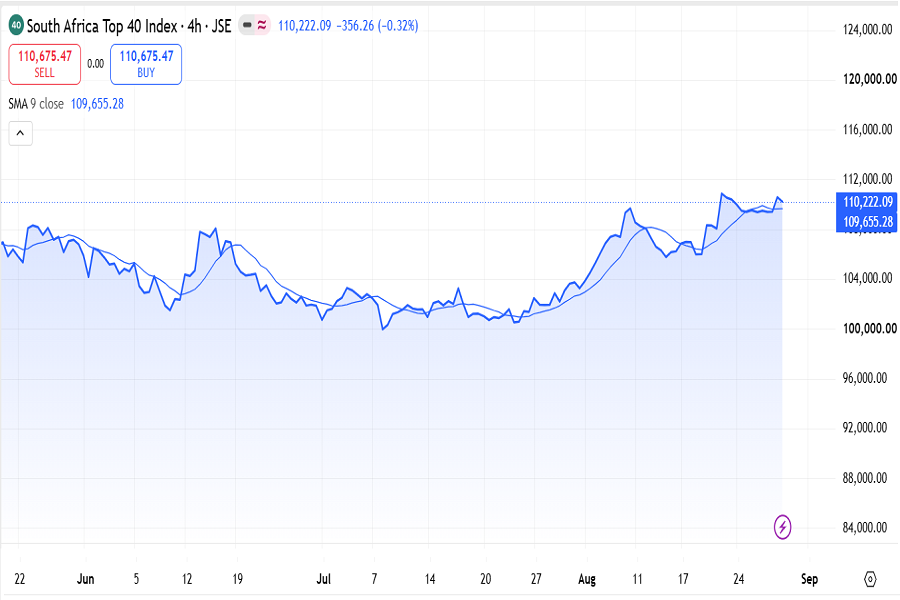
JSE TOP40 H4 chart, August 24-28
Despite the near-zero index movement at the end of August, the chart can be viewed as upward, without price corrections. Most technical analysis indicators show a Strong Buy signal.
2. Dow Jones index
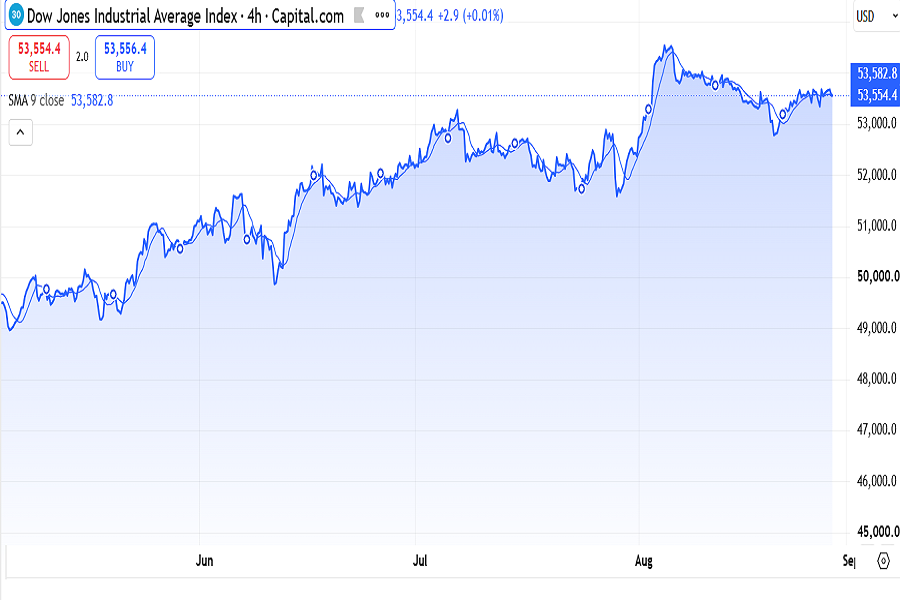
Dow Jones 30 index August 24-28 chart H4
Although the index had previously shown significant volatility, the last week of August proved to be a lull. Technical analysis indicators are pointing downwards, although the upward trend is undeniable.
3. S&P500
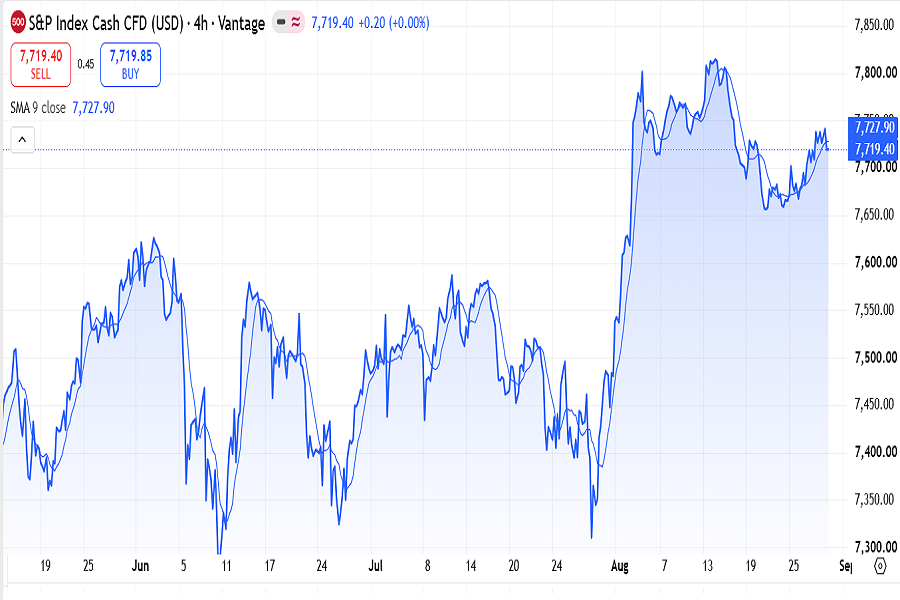
S&P500 index, August 24-28
The situation is radically different from what we saw a month ago. Volatility is approaching zero. Even technical analysis indicators are neutral, although the stochastic oscillator and moving average are trending downward.
4. Nasdaq Composite
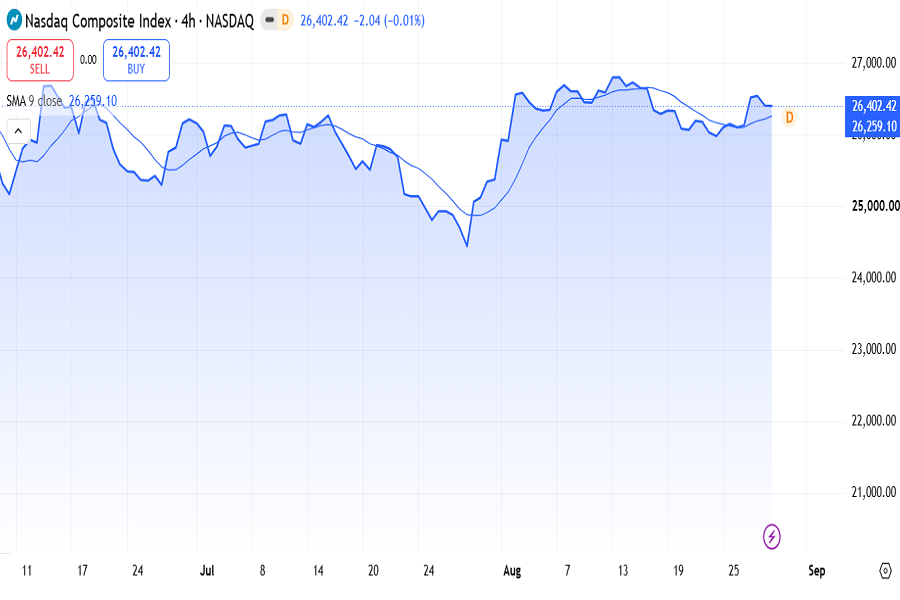
Nasdaq Composite index, August 24-28 chart
The index showed the highest volatility among positive indices, adding up to 1.4% over the week, driven by positive news from Nvidia. Tech indicators show us Buy signal.
5. UK100 index
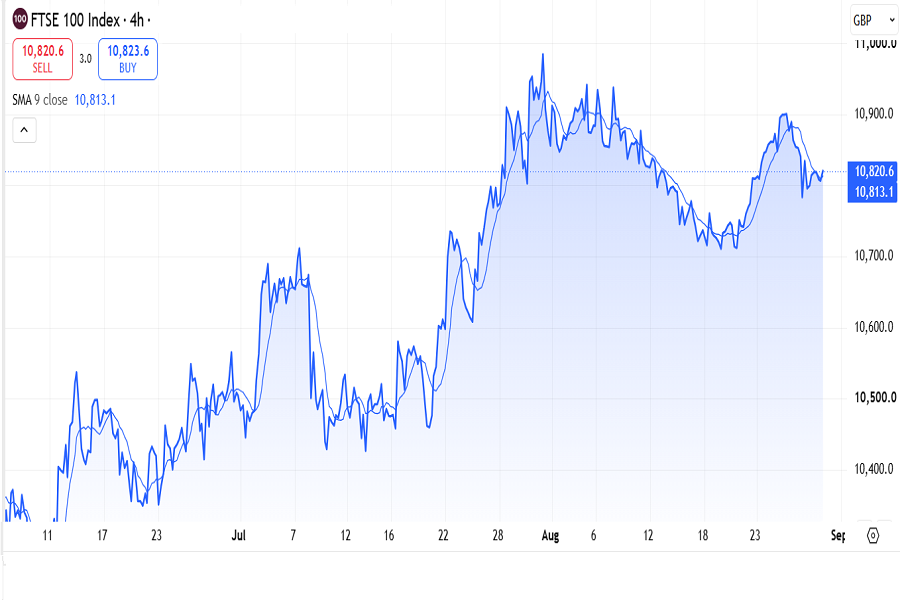
UK100 index August 24-28 chart
The UK100 is trading right at the ceiling of its historic range (10,824). Breaking and holding above 10,850 – 10,900 triggers a breakout toward 11,000+, while failure to clear this resistance suggests a short-term consolidation back toward the 10,500 support level.
According to the chart, prices are poised to resume their upward movement, despite near-zero momentum this week. Tech indicators show us Buy signal.
Key Currencies digest for the last week of August
The overall picture for currencies this week is the same theme that drove stocks: the dollar strengthened all week on anticipation of new Federal Reserve Chairman Kevin Warsh's debut speech at Jackson Hole on Friday (the symbolism itself is also interesting - it's Warsh's debut speech in his new position, so the market was paying close attention).
EUR/USD
EUR/USD fell by about 0.8%, holding at 1.1645, the lower end of its weekly range, while the dollar was trading near a weekly high even before the FED speech.
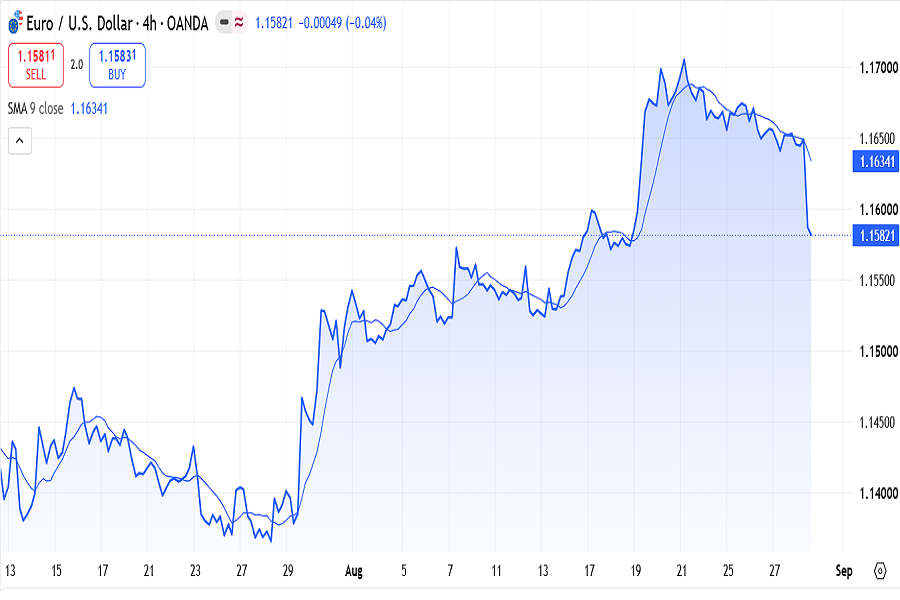
EUR/USD H4 chart, August 2026
As the chart shows, the stock has lost all its upward momentum over the past 10 days following the Fed Chairman's hawkish speech. Technical analysis indicators are signaling a sell signal.
Next week, business activity indices and unemployment reports could drive the dollar. In the eurozone, the inflation report and the ECB president's speech will be the focus.
2. USD/ZAR
The rand weakened by about 1.1%, giving back some of last week's gains (when the pair tested April lows of 15.92 against the backdrop of a softer dollar); by Friday, the pair had returned to ~16.17.
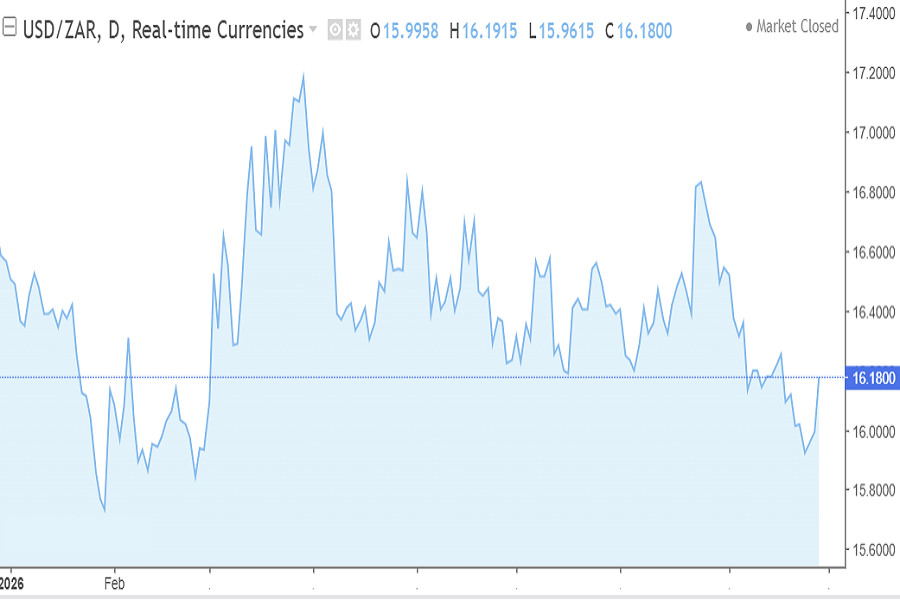
USD/ZAR chart in August 2026
On the chart we observe downward trend. Latest momentum can be observed as a price correction. Although tech indicators says Strong buy, we wouldn't trust this signal. Still we're talking about downward trend and alocal price correction is the maximum we can get. Near the level 16.35 R the trend can return back down - in favour of Rand.
3. USD/JPY
The yen weakened by ~0.5%, the pair rose from ~159.2 to ~160.1 amid strengthening US Treasury yields.
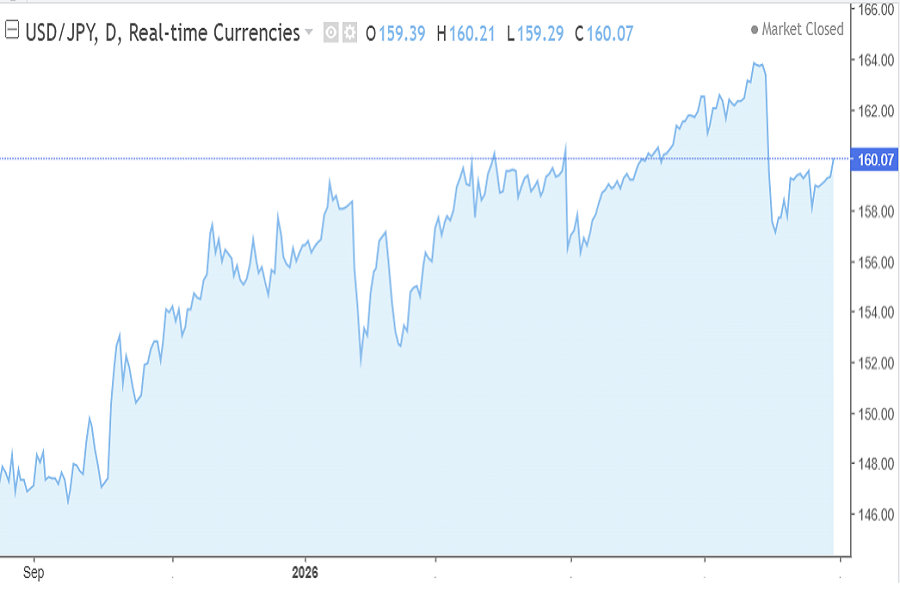
USD/JPY chart, August
The USD/JPY chart has a peculiar appearance due to currency interventions: each successive wave exceeds the previous one and then ends abruptly. A new wave is just beginning now.
In this case Strong Buy signal by tech indicators seems true.
Summary
Thus, The dollar remained the key factor influencing equity markets, and the mining sector, which dominated the week's headlines on the JSE, in all cases received a more muted market reaction than might have been expected from the figures. Even Northam Platinum, whose report (HEPS +699%) coincided with rumors of a takeover by Valterra, rose only a modest +3.1% on the day of the news, rather than the tens of percent that such a dual combination of catalysts would have justified.
In one of the most eventful weeks for corporate events, investors were undoubtedly hoping for more pronounced positive volatility. However, negative macrofinancial factors, primarily the strengthening dollar ahead of Fed Chairman Warsh's debut speech at Jackson Hole suppressed optimism and forced the market to remain in a holding pattern, postponing a clearer reaction until next month, when the picture of monetary policy, the economy, and geopolitics may become clearer.

Stan Lytynsky
Stan Lytynsky is a well known financial expert with more than 1000 of market reviews. For the last 10 years he wrote reviews for different blogs and websites. In particular he worked for SuperForex and Zetradex forex brokers as a market analyst. Currently he is living in Canada and focused on the African market as the most promising and growing.
Comments
Loading comments…
Log in or sign up free to join the discussion.