What is Technical Analysis? Introduction to the course
Technical Analysis Masterclass “Guru of tech analysis in a 10 steps” (JSE Beginner Series). Length: ~15–18 minutes

Thandiwe Mbeki
Published · Updated
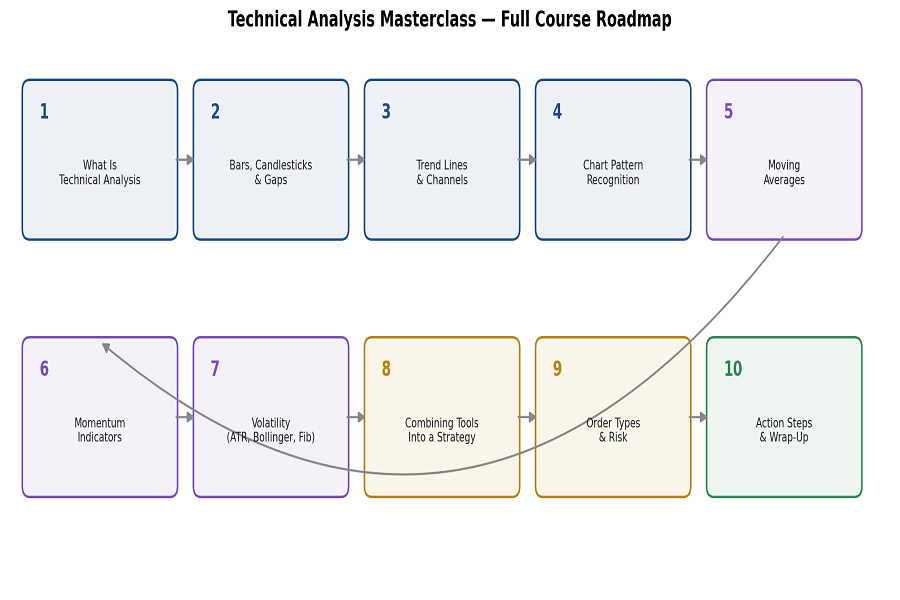
Course "Guru of technical analysis in 10 steps"
Lecture 1: What Is Technical Analysis and How Does It Work
Welcome to the first lecture in this course. Before we open a single chart or talk about a single indicator, we need to answer a more basic question: what is technical analysis actually trying to do, and why do some traders swear by it while others dismiss it entirely?
By the end of this lecture, you'll understand the core idea behind technical analysis, how it differs from fundamental analysis, what it can realistically do for you as a JSE investor or trader, and what it can't. We'll also meet the three companies we'll be using as running examples throughout this course.
Two Ways to Look at the Same Stock
Imagine two analysts looking at the same company on the Johannesburg Stock Exchange. The first one opens the company's latest financial statements. She studies revenue growth, profit margins, debt levels, management quality, and the competitive landscape. She's asking: what is this business actually worth? This is fundamental analysis.
The second analyst doesn't look at a single financial statement. Instead, he opens a price chart. He studies the pattern of highs and lows, the volume of shares traded, and where the price is relative to its recent history. He's asking a different question entirely: what is the price telling me right now, and what is it likely to do next? This is technical analysis.
Neither approach is "correct" in some absolute sense — they're answering different questions. Fundamental analysis tells you whether a business is good. Technical analysis tells you what other market participants are doing with their money, right now, as reflected in the price. This course is about the second question.
The Core Logic of Technical Analysis
Technical analysis rests on a few simple assumptions. You don't have to accept them as universal truths, but understanding them will help you understand why technical analysts do what they do.
First: price reflects everything that's currently known. Every piece of public information about a company — earnings, news, sentiment, rumours, macroeconomic conditions — eventually shows up in the price, because buyers and sellers are reacting to it in real time. A technical analyst doesn't need to read every news article about Sasol to know that something significant happened last month — the price chart already shows the reaction.
Second: prices move in trends. Once a stock starts moving in a direction, it tends to continue in that direction until something changes the balance between buyers and sellers. This isn't a law of physics — it's a pattern that shows up often enough to be useful.
Third: history tends to repeat, because human behavior repeats. Fear, greed, panic, and euphoria are constants. The specific companies and headlines change every year, but the patterns those emotions create on a price chart tend to look remarkably similar across decades and across markets — including here on the JSE.
Why market "Trends" Aren't Magic?
Let's slow down on that second assumption for a moment, because it's the one that does the most work in this course. Why would a stock that's been rising keep rising, instead of just moving randomly?
Part of the answer is structural. Large institutional investors - pension funds, asset managers, the big players who move real size on the JSE, can't buy or sell their full position in a single trade without moving the price against themselves. So they build or unwind positions gradually, over days or weeks. That gradual buying or selling itself creates a trend, because the same directional pressure is showing up in the order book day after day.
Part of the answer is psychological. When a stock is rising, existing holders feel validated and hold on for more, while people who missed the move start looking for a reason to get in - which adds more buying pressure. When it's falling, the reverse happens: holders start doubting their reasoning, and new buyers stay away, waiting for "confirmation" that the bottom is in. Neither of these behaviors is irrational exactly, but together they tend to extend moves in both directions longer than pure logic would suggest.
This doesn't mean trends never end. They always do, eventually. It means that while a trend is intact, the underlying forces that created it tend to still be there, which is why "the trend is your friend" became a cliché in trading circles in the first place. We'll spend a full lecture later in this course on how to actually identify and draw a trend, but it's worth understanding why the concept works before we get there.
What Technical Analysis Is Not?
It's worth being direct about this early, because a lot of course-sellers won't tell you: technical analysis is not a crystal ball, and it doesn't produce guaranteed winners. It's a framework for thinking about probability, not certainty.
A textbook-perfect chart pattern can fail. A stock in a clear uptrend can reverse without warning on news nobody saw coming - a surprise regulatory announcement, a commodity price shock, a sudden shift in the rand. No indicator, no pattern, and no amount of experience will filter that out completely. What technical analysis offers isn't prediction, it's a structured way to read what's happening in the market right now, and a set of tools to manage your risk if you're wrong, which you sometimes will be.
This is also a good moment to name something directly: if you've seen adverts promising to turn you into a trading "guru" in a week, or guarantee you'll become a millionaire trading JSE shares - treat those claims with real scepticism. Technical analysis is a genuinely useful skill, but it's a skill you build over months of practice, not a shortcut around risk. Anyone promising you a "sure thing" based on a chart pattern is not being straight with you, and the sooner you internalize that, the better your decision-making will be once real money is on the line.
Meet Your Three Case Studies
Throughout this course, we're going to keep coming back to three real JSE-listed companies. Each one shows us a different kind of price behavior, and together they'll let us see how the same tools - trend lines, moving averages, momentum indicators — apply in very different situations.
Naspers has spent the past year in a persistent downtrend, losing well over a quarter of its value from its highs, with occasional sharp rallies along the way that failed to change the overall direction. This is our example of a stock in a sustained decline - useful for talking about resistance, failed rallies, and knowing when not to catch a falling knife.
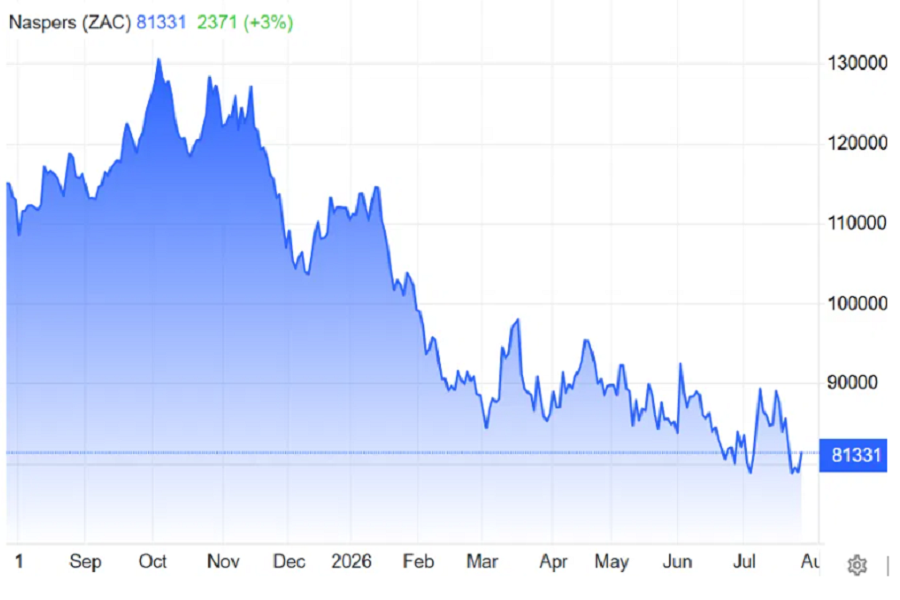
Naspers chart, July 2026
Sasol tells a more dramatic story: a powerful rally that more than doubled the share price over several months, followed by a sharp pullback, and then a partial recovery. This is our volatility case study — a good example of how momentum can shift quickly, and why risk management matters even in a stock that's "working."
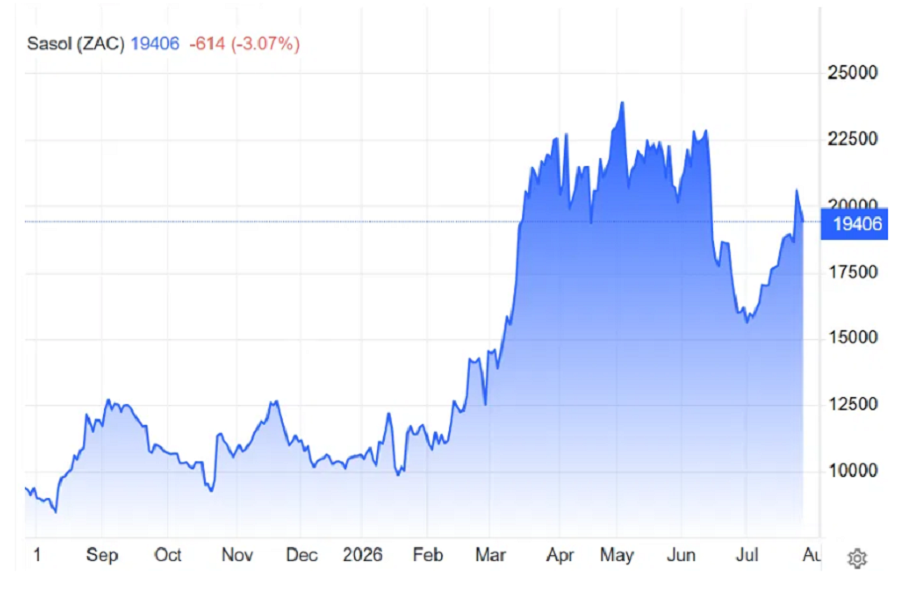
Sasol chart, July 2026
Standard Bank, by contrast, has been the steady performer of the three: a comparatively smooth uptrend with far less drama than the other two. This is our example of what a healthy, sustained trend looks like, and it'll be useful later when we talk about trend-following strategies.
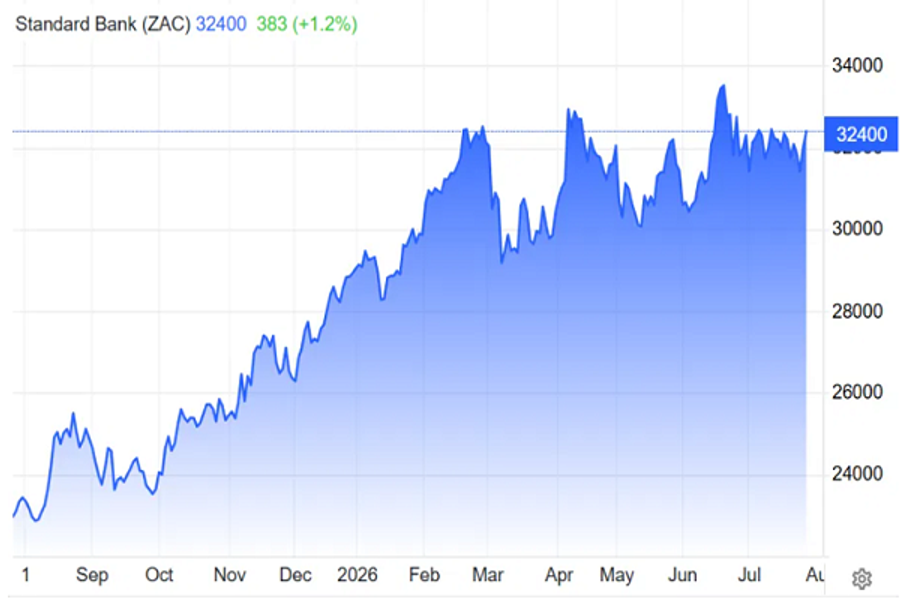
Standard Bank chart, July 2026
We're deliberately using one stock in decline, one in high-volatility recovery, and one in a steady climb because in the real world, your portfolio will contain all three types at different times, and the skill isn't picking the "right" one in advance. It's recognizing which situation you're in and reacting appropriately.
Think about what a new trader typically does with each of these three charts if they're only looking at the news, not the price action.
- With Naspers, they might keep buying every dip because the company is a familiar, well-known name without noticing that the chart itself is telling a story of sustained selling pressure.
- With Sasol, they might chase the rally near its peak, excited by the headlines about the stock "doubling," only to be caught in the pullback that followed.
- With Standard Bank, they might dismiss it as "boring" and overlook one of the more dependable trends of the three. In each case, looking at the chart itself rather than the narrative around the stock - would have changed the decision. That's the habit this course is trying to build.
Why This Matters for a JSE Investor Specifically?
Technical analysis was developed decades ago in US and European markets, but the logic applies anywhere prices are set by buyers and sellers reacting to information and emotion, and that includes the JSE. That said, our market has its own personality: lower average trading volumes than markets like the NYSE, a heavy weighting toward resources and financials, and a rand exchange rate that adds an extra layer of volatility to almost every chart you'll look at. We'll flag these JSE-specific quirks as they come up rather than pretending our market behaves exactly like Wall Street.
What's Coming Next?
Over the rest of this course, we'll build up your technical analysis toolkit piece by piece:
- How to read a price chart at the most basic level: bars, candlesticks, and gaps
- Drawing trend lines and channels
- Recognising chart patterns that signal continuation or reversal
- Using moving averages to define and follow a trend
- Momentum indicators that tell you when a move is losing steam
- Volatility tools that help you size your risk correctly
- How to combine all of this into an actual trading approach
- Managing a trade once you're in it - order types, stop-losses, and risk
None of this will make you infallible. What it will do is give you a consistent framework for reading a chart, instead of reacting to every zig and zag on gut feeling alone. That's a realistic, achievable goal — and it's the one this course is built around.
How to Get the Most Out of This Course?
One last practical note before we move on. Technical analysis is a visual, hands-on skill. You won't absorb it by listening passively. As we go through each lecture, open a live chart of your own - Naspers, Sasol, and Standard Bank if you want to follow along with our case studies, or any JSE stock you already hold or watch and try to spot what we're describing on your own screen. The concepts in this course will make far more sense once you've traced a trend line or spotted a candlestick pattern with your own hand on your own chart, rather than just watching someone else point at one.
See you in the next lecture, where we start with the absolute foundation: how to actually read a price bar and a candlestick.
Build your watchlist
Track the stocks you just learned about — get price alerts and daily updates.
Go to your watchlist