JSE & Global Weekly Digest. September 2026. Week 4


This was a week where the bond market set the tone. The US 10-year Treasury yield climbed above 5.2% for the first time since June 2007, while the 30-year yield reached levels last seen in 2004. Oil swung back and forth on Iran headlines. The results split cleanly by market: the US tech complex shrugged off the rate shock on the back of a fresh AI rally, London remain flat as during the whole month, and Johannesburg absorbed a rate hike at home.
How the markets reacted?
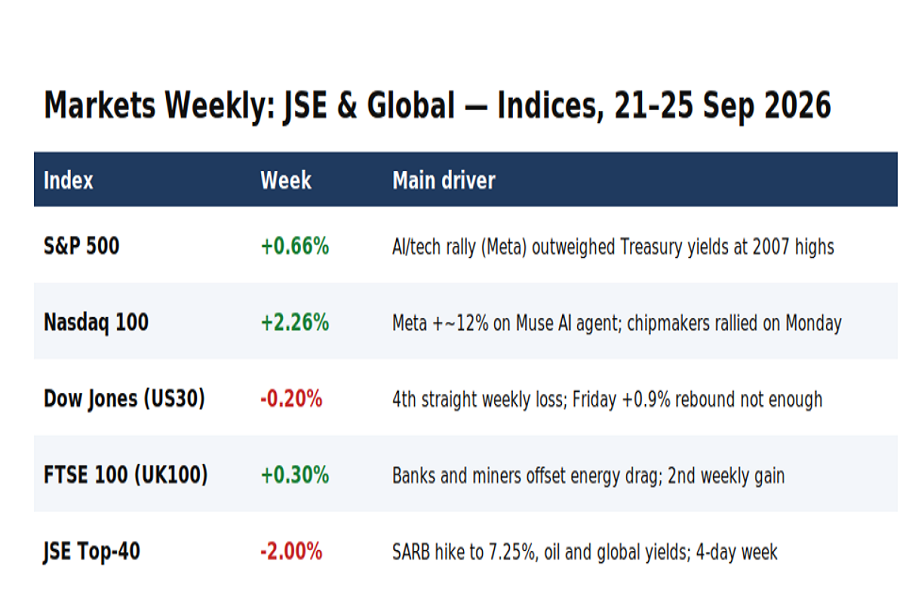
The tech-heavy indices won the week, value-heavy benchmarks struggled. The most dramatic fall show South African index being under pressure due to rate hile over the negative external factors. Reviewing each stock market in details.
JSE Market – Last full Week of September.
South Africa saw a shortened trading week with few scheduled corporate events, yet the news landscape proved exceptionally busy. The spotlight was on the central bank meeting and the decision to raise the benchmark interest rate. The regulator highlighted rising global government bond yields and surging oil prices that are fueling inflation. Although the tone was measured, major index constituents particularly in the financial and mining sectorsб remained under pressure. This week can rightly be described as the stock market's worst of September.
Against this backdrop, the 15.63% rally in Gemfields Group shares appears remarkable. The company reported a successful emerald auction that generated record revenue. Major investors rushed to buy the stock after spotting it at a local low.
The company also announced the completion of the plant closure cycle (Mupane/Montepuez). This will ease the burden on the company's balance sheet in the coming quarters.
JSE TOP-40 index tech review
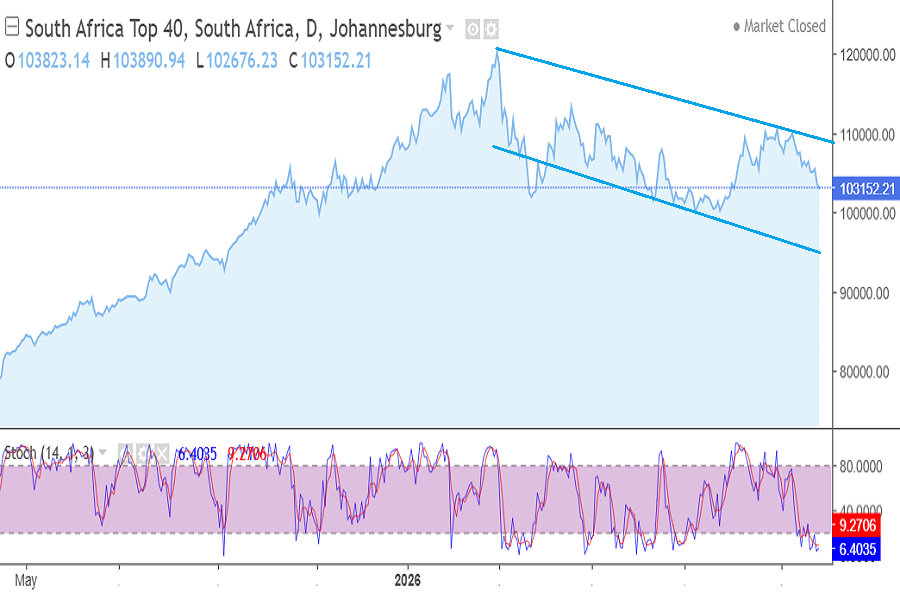
JSE TOP-40, September 21-25, 2026
South Africa’s main index fell by a full 2%—the largest drop among all the indices analyzed and the sharpest decline seen throughout September. All factors weighed negatively on the South African market.
A slight recovery is possible next week; however, the chart shows strong downward momentum, with the support level situated below the psychological 100,000 mark. That level is within easy reach, requiring a decline of just 3%. Meanwhile, technical analysis indicators are unanimously signaling Strong Sell for the index. So we believe - no way but downward for the next few months.
Last week of September for the UK stock market
It has been a relatively quiet week on the London Stock Exchange. The external and internal macroeconomic storm has passed. However, external factors and rising government bond yields, particularly in the US are exacerbating stagnation in the stock market. Throughout September, the index has been hovering in negative territory, reflecting a balance between the bulls and the bears.
There are undoubtedly ups and downs, no matter what.
Ashtead Technology Holdings (LSE: AT.) soared 54.27% this week after the subsea equipment rental group revealed a takeover approach. On 23 September the company disclosed an unsolicited cash proposal of 615p per share from US-based Ember Infrastructure Management - Ember's fourth approach, after the board rejected the first two. The board is now weighing the offer with its advisers and has started sharing preliminary due-diligence information with Ember, which has until 21 October to make a firm offer or walk away. The bid came at a low point for the shares, which had slumped to 326p in early September after an August profit warning linked to Middle East project delays. Even after the rally, the stock trades well below 615p, suggesting the market still sees a risk that the deal falls through.
If you're optimistic regarding the deal you can purchase this stocks for 523 GBX and have a chance to sell for 615 later - 17.59% benefit on each stock.
Pensana Plc (LSE: PRE) was the UK market's hardest-hit stock this week, losing 27.95%. The rare-earths developer, which is building the Longonjo magnet-metals mine in Angola, admitted on 25 September that only US$15 million of a promised US$165 million investment from Qatar-backed Cascade has been received so far. Pensana said it is now in detailed financing talks with its major shareholders. A signal investors read as likely dilution and has slowed high-cost site work and long-lead equipment purchases until funding is secured, extending the construction schedule. Construction is just over 30% complete, while the company has also farmed out its neighbouring Coola project to ASX-listed Tyranna. For a pre-revenue miner, delays in funding go straight to the share price.
UK100 index at the end of September
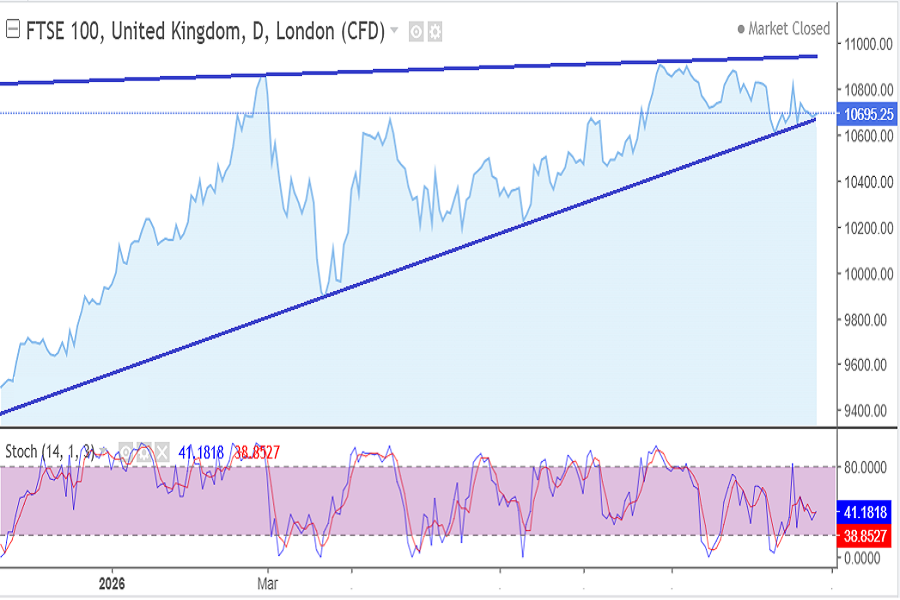
UK100 index September 21-25, 2026
Take a look at this chart. The upward trend appears to remain intact, yet the support line is being repeatedly tested, and upward momentum has been lost since July 30. Technical indicators still signal a sell, and we wouldn't disagree. Although the index closed the week up 0.3%, it still looks like a trend reversal.
US stock market at the last full week of September 2026
The US stock market was clearly under the greatest pressure due to government bond yields rising to 2007 levels- a mark that not only represents a historic milestone but also predates the 2008 crisis. Nevertheless, the AI rally acted as a driving force for US technology companies and the indices that include them. This enabled most indices to hold their ground at elevated levels or even post gains of a few percent.
Who won the US race this week? To your surprise AI-related company, supplier of components for date-centres industry - Vicor Corporation (Nasdaq: VICR).
Their stocks added 25.95% this week after the power-components maker delivered a hard catalyst for its AI story. After Monday's close, Vicor raised its third-quarter guidance, now expecting sequential revenue growth of more than 20%, up from nearly 10% previously. The upgrade was driven by royalties from a non-exclusive license for its patented Vertical Power Delivery technology, which delivers high current directly to power-hungry AI processors. The licensing deal with an unnamed OEM, announced the previous week, lets the customer source these modules from other suppliers while still paying Vicor for its intellectual property. With its existing chip fab near full utilisation, Vicor is also acquiring sites in New Hampshire for two new fabs that will nearly triple capacity.
Vicor stocks already added 444% for the last 12 months reflecting AI-rally on the stock market. This week result show it's not a limit.
On NYSE we have one more incredible rally with Another technological company, involved in the provision of data storage and management - for sure useful service if you're going to build data-centre.
Everpure, Inc. (NYSE: P) stocks added 19.37% this week after its investor day gave the market a bold long-term outlook. At its Financial Analyst Meeting on 23 September, the data-storage company reaffirmed its fiscal 2027 guidance of $5.03–5.07 billion in revenue and $940–960 million in adjusted operating income. It then introduced preliminary fiscal 2028 targets of $7.0–7.3 billion in revenue and $1.7–1.9 billion in adjusted operating income - nearly double this year's profit guidance. Bank of America raised its price target to $180 from $150 and reiterated its Buy rating. For the last 12 months Everpure stocks added 50% in value.
Oddly enough, a somewhat different story involving another company has emerged this week; while it concerns software, that software is unrelated to data centers or AI in general.
Gen Digital Inc. (Nasdaq: GEN) was the week's biggest loser, sliding 26.66%. The owner of Norton, Avast and LifeLock tumbled 12% on 24 September after reports that it had made a preliminary takeover approach for GoDaddy, and extended its losses on Friday. The reported plan would use GoDaddy's domains and huge small-business customer base to sell Gen's security and identity products. Investors, however, focused on the cost: Gen already carries around $8 billion of net debt, according to StoneX, and a deal of this size would likely require more borrowing or new shares. Gen Digital has not confirmed the approach. Even so, the market's verdict was clear - shareholders fear strategic overreach more than they welcome the potential synergies.
News of an acquisition is typically met with a rise in share price, but not when the company is in debt and the deal is driven not by growth prospects, but by the desire to acquire a customer base for cross-selling core services. Investors were therefore fully justified in their dissatisfaction, responding by selling off the stock.
US indices this week: tech point of view
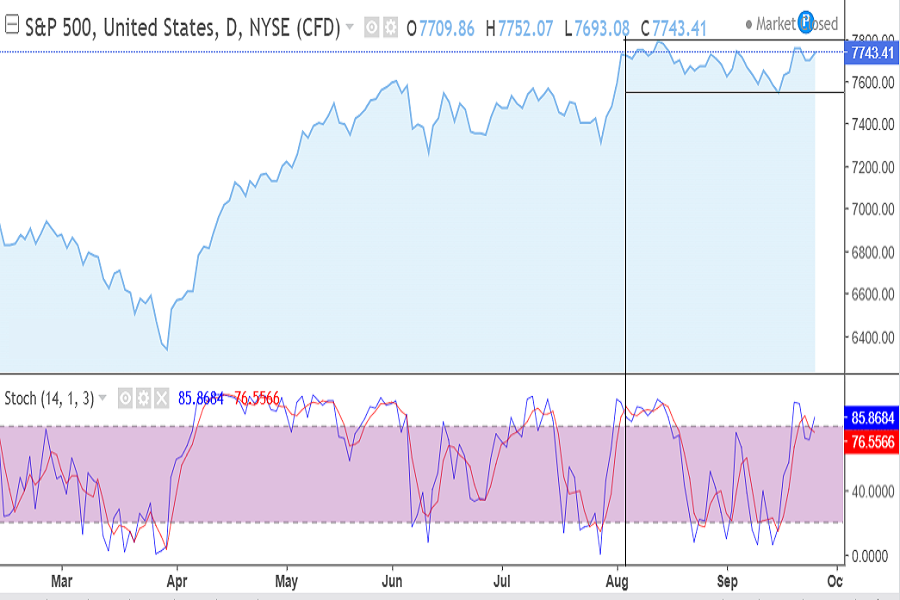
S&P500 index September 21-25 2026
The index has fully consolidated within the 7549.38–7794.00 range, and despite numerous negative factors, this structure remains robust. This week, the index gained less than one percent while remaining within that range. Technical indicators are signaling a buy, yet upward movement appears limited. Reaching all-time highs has proven difficult of late, and the negative factors at play are long-term issues that will not disappear from the radar in the foreseeable future.
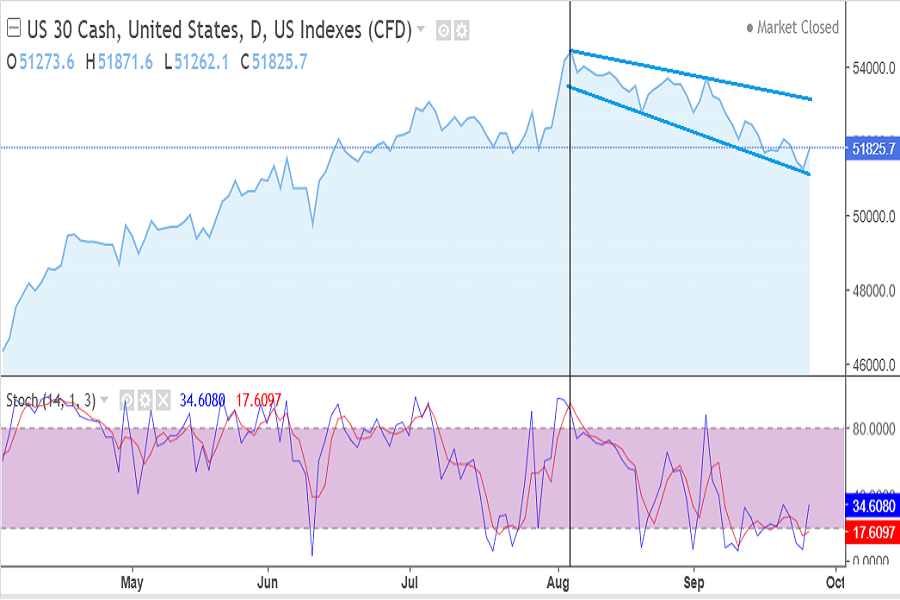
US30 index September 21-25 2026
US30 index show us decent downward trajectory in August-September. This week almost no losses but we can't talk about sign of price correction or upward perspective. Tech indicators show Sell signal. No changes here. It can be a start of long downward trend.
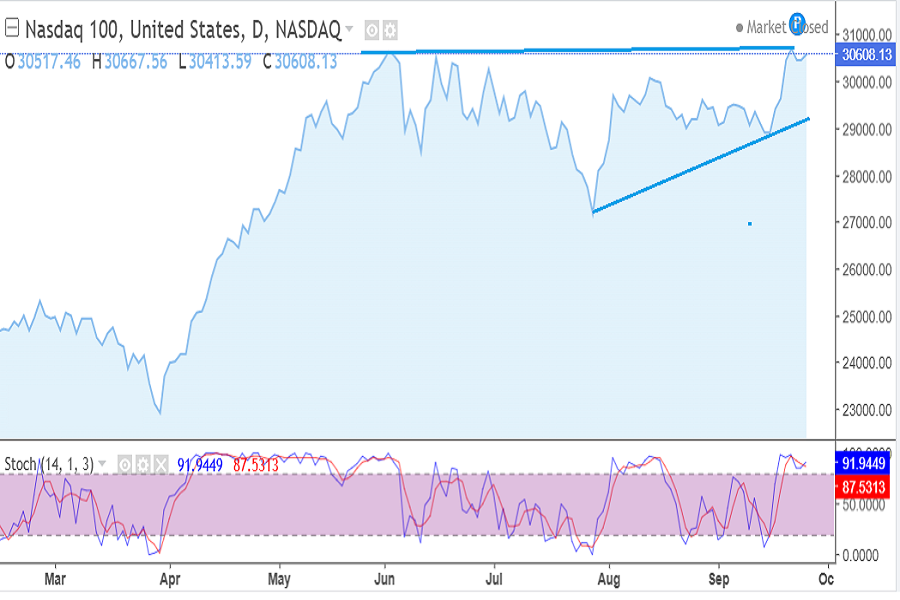
Nasdaq100, September 21-25 2026
Nasdaq100 seems the only index with decent upward movement second week in a row - around 5% for the last 2 weeks. A lot of rallies stories comes from Nasdaq after all, despite negative around. However the chart looks unstable. Resistance line is almost flat and support line reversed up not long ago. You have all reasons to stay sceptic here. Maybe next week we will see if the index is able to save upward trend. Currently it's not clear to us but according to tech indicators we have a Strong Buy signal.
Key currencies this week. Fast tech overview
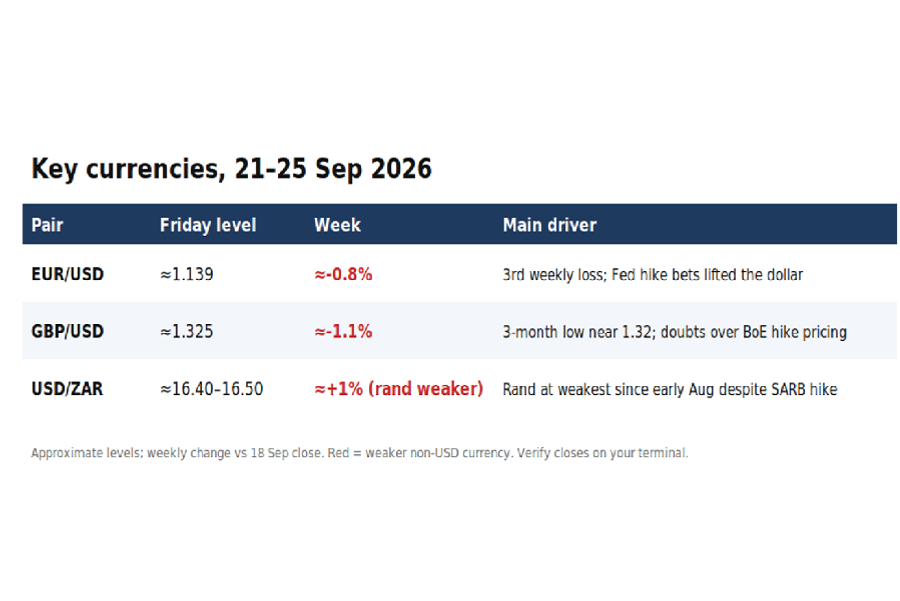
The dollar had the upper hand all week. Growing expectations of another Federal Reserve hike this year, backed by hawkish Fed commentary and strong US data, kept the greenback bid, and the US Dollar Index hovered near an eight-week high of 101.40. All 3 compaired currency pairs are losing approximately 1% versus USD this week.
EUR/USD for the last week of September 2026
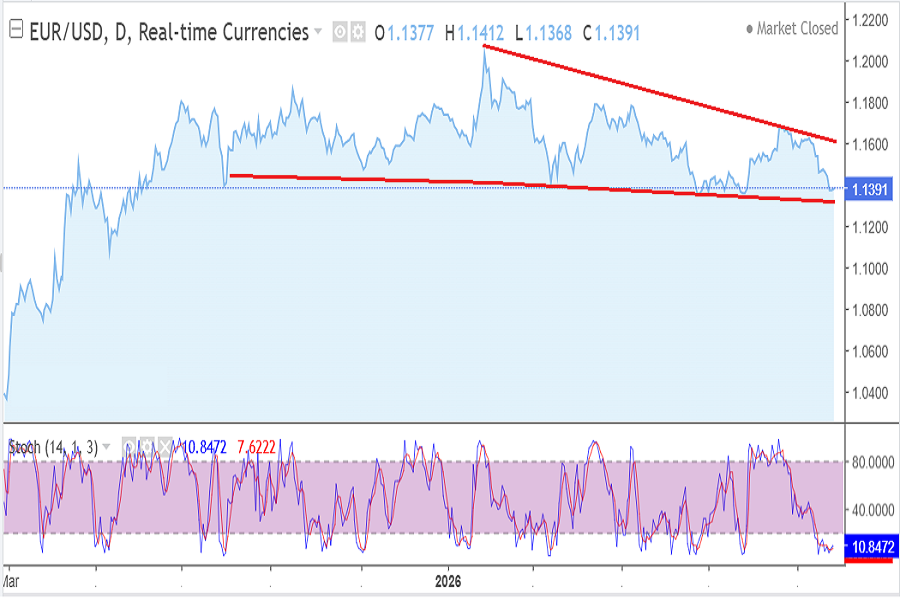
EUR/USD September 21-25, 2026
As we predicted last week, the price has continued to decline in line with the current trend. Given this ongoing wave-like trend, there is a high probability of a price correction in the near future. What could trigger this? For instance, macroeconomic data due for release next week. For example, published next week, US Q2 GDP figures or US unemployment data, could act as catalysts if they come in below expectations.
Stochastic oscilator, being in the oversold zone is also a sign of possible upward wave although as a whole tech indicators show us Strong Sell signal. This does not rule out the possibility of price corrections but indicates the trend's future trajectory in the medium term.
2. USD/ZAR for the last week of September 2026
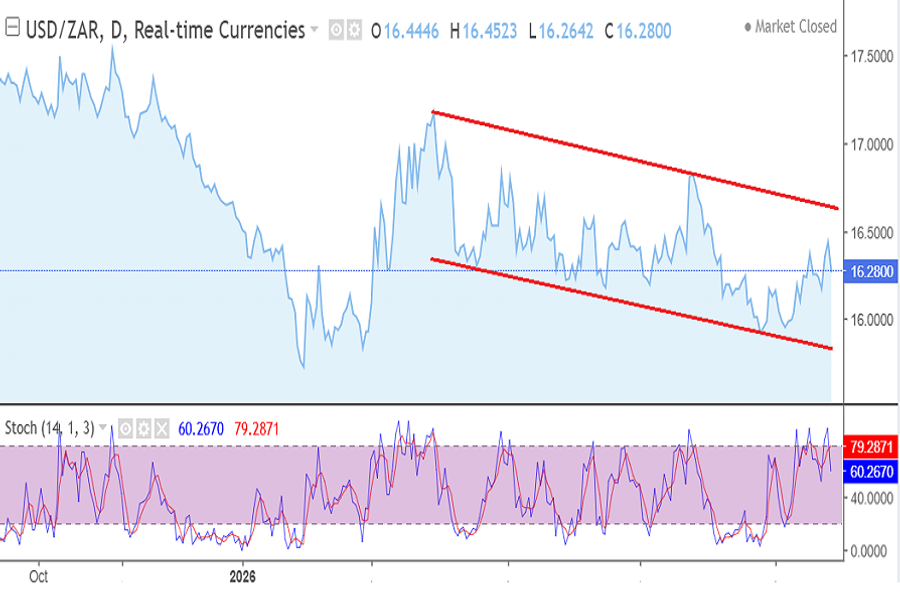
USD/ZAR September 21-25, 2026
The downward trend that has developed for this pair over the past six months appears stable and robust. The rand certainly lost ground this week following the benchmark interest rate review. The upward movement is clearly consistent with the prevailing trend and represents a price correction that is unlikely to last long. The business activity index might provide support for the rand next week. Technical analysis indicators remain confused. We place greater weight on signals pointing to a strengthening of the rand in this case.
3. GBP/USD fast overview
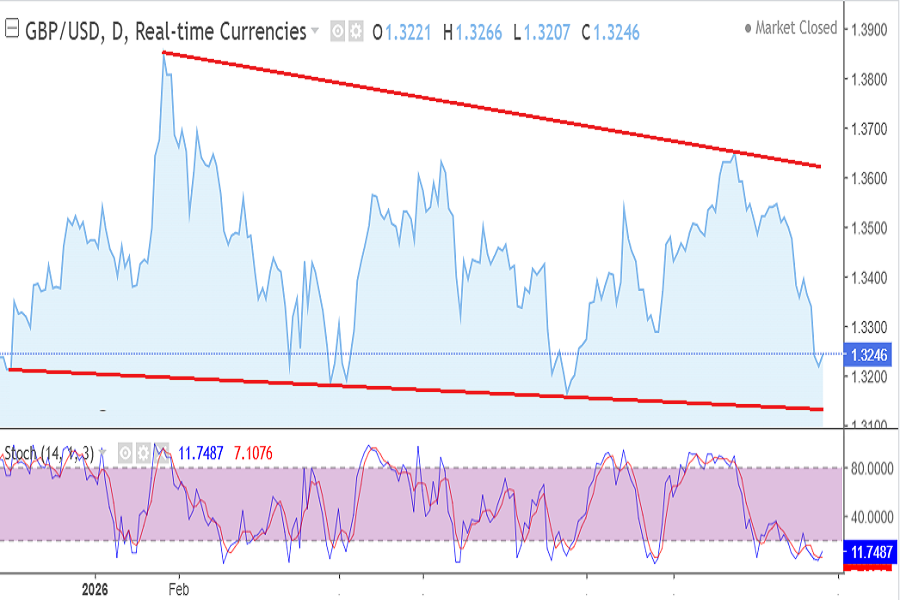
GBP/USD September 21-25, 2026
This chart is characterized by high volatility and a wide range. Nevertheless, the situation is similar to that of the EUR/USD pair. The wave-like structure of the downtrend suggests that a new upward wave and a substantial one, in this case is imminent. The Stochastic oscillator, currently in oversold territory, supports this likelihood. For instance, a price correction could be triggered by the release of UK GDP data next week, provided the figures are strong.
JSE & Global markets for the week 4 of September: Summary
It was a week of rising yields, where the market punished rate-sensitive stocks and rewarded AI stories. Investors found stock markets under pressure despite previous week was even harder. However negative factors still show their strong impact, especially on financial and mining sector.
Next week, all eyes are on US nonfarm payrolls, US and UK GDB Q2 data, which will show whether the Fed needs to hike again.

Stan Lytynsky
Stan Lytynsky is a well known financial expert with more than 1000 of market reviews. For the last 10 years he wrote reviews for different blogs and websites. In particular he worked for SuperForex and Zetradex forex brokers as a market analyst. Currently he is living in Canada and focused on the African market as the most promising and growing.
Comments
Loading comments…
Log in or sign up free to join the discussion.