JSE & Global Markets Weekly Digest. On the start of October


Stock markets kicked off October and the fourth quarter this week in a rather gloomy mood. Almost all the indices we tracked ended in the red. Only the S&P 500 managed to hold steady at the flatline. The primary negative driver was the rise in government bond yields in the US and the UK, while South Africa grappled with a weakening rand and falling precious metal prices. Banks in London and Johannesburg remained under pressure. We are starting our review on a downbeat note, but we will try to survey the various markets in search of some positive.
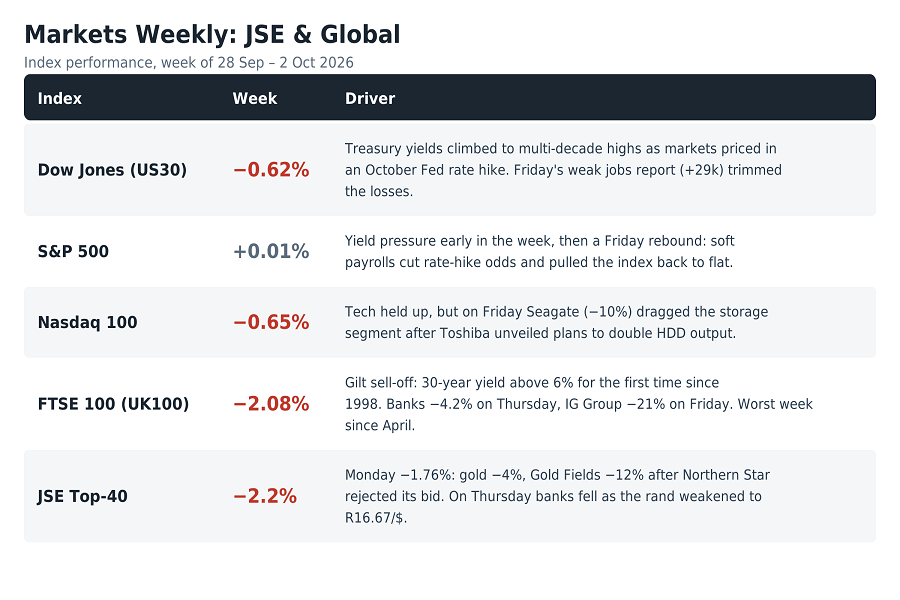
Stock indices comparison weekly
How the JSE met October 2026?
Despite two days of trading on the exchange in October, we have not seen a new breath. To be honest the most important events occured within September 28-30. So events of October is a question of future weekly reviews.
A heavy hitter took a tumble: Gold Fields fell 12% on Monday. Australia’s Northern Star unanimously rejected its A$38.7 billion takeover bid. That same day, the price of gold dropped nearly 4% amid expectations of another Federal Reserve rate hike, while Harmony, Impala Platinum, and Sibanye-Stillwater saw losses ranging from 4% to 5.4%. Report of the week: Capitec (JSE: CPI). One of the biggest South African banks, released its results for the six months ending August 31, 2026: headline earnings rose 19% to R9.5 billion, and the interim dividend was increased by 19% to 3,110 cents. Key drivers included non-interest income (+21%), fintech (+32%), and insurance (+28%). The number of business clients more than doubled to 686,000, and ROE stood at 31%. Infortunately due to pressure on financial sector, this report isn't reflected well on the stocks value. Investors decided to take a wait-and-see position regarding #CPI stocks.
The week’s top gainer was Putprop (JSE: PPR), up 30.9%. Shares of the property developer rose following a cautionary announcement on September 30: the board is considering a cash buyout of minority shareholders, which would be followed by a delisting from the JSE. While the buyout price has not yet been determined and the deal might not materialize, investors were encouraged by the prospect of another company leaving the exchange and rushed to buy shares while they were still available.
JSE TOP-40 index tech review
Almost the entire weekly decline of the Top-40 (−2.2%) occurred on Monday, when the index lost 1.76%. At that time, the prices of gold and other metals fell, leading to a revaluation of mining company shares. On Thursday, a weakening rand added to the pressure, hitting the banking sector. Consequently, the South African index suffered greater losses than the other four foreign indices, continuing the downward trend we had previously observed.
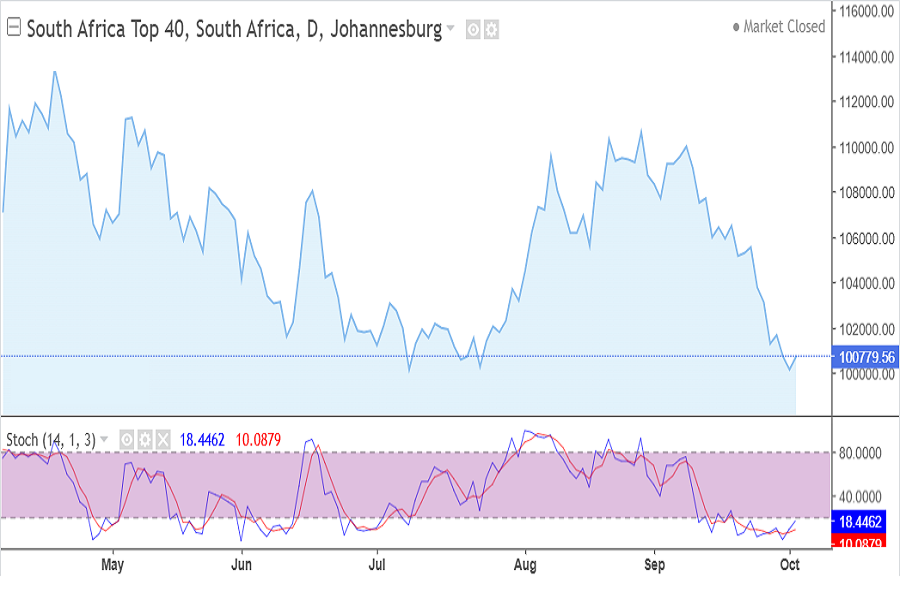
JSE TOP40, October 2026
The chart shows quotes in oversold territory for a duration of about 20 days. That is too long. The index has dropped another 2.2 percent, and we have every reason to expect a correction in October following a bearish rally that lasted virtually the entire month.
We are once again seeing a sell signal from technical analysis indicators, but this does not contradict expectations of a correction; meanwhile, oscillators clearly point to a high probability of a rebound from the lows.
UK stock market weekly review (with focus on LSE)
The sell-off in British government bonds hit the banking and financial sectors hardest. This triggered a tectonic shift in British indices, which had been in a consolidation phase throughout September and had remained neutral even during periods of high volatility.
Against this backdrop, the "Fall of the Week" comes as no surprise: financial services provider IG Group (FTSE 100) dropped 24.5% over five trading days. The British online broker effectively issued a profit warning. Third-quarter revenue is expected to be 14% lower year-on-year, as the company is retaining less revenue from clients' losing trades in OTC derivatives. The revenue growth forecast for 2026 has been lowered to the mid-single-digit range, down from the previous 10–15%. The sector also took a hit: Plus500 fell 5.1% and CMC Markets 4%. For IG itself, this marks the second major slump in just a few months.
Rally of the week belongs to Saga Plc - a British company, engaged in the provision of travel, financial, healthcare and media products and services. It operates through following segments: Insurance, Travel, and Other Businesses and Central Costs. It is rare to see a travel-related company among the market leaders, but this firm earned its spot through a strong earnings report and solid operational results. For the week their stocks added in value 22.5%. The company nearly doubled its underlying pre-tax profit for the half-year and raised its full-year guidance. Ocean cruises were the primary growth driver. Debt was reduced by £70 million, and Saga expects to meet its medium-term targets - £100 million in profit and leverage below 2x are ahead of the 2030 deadline. Shares rose by approximately 13% on the day the report was released.
UK100 index tech review
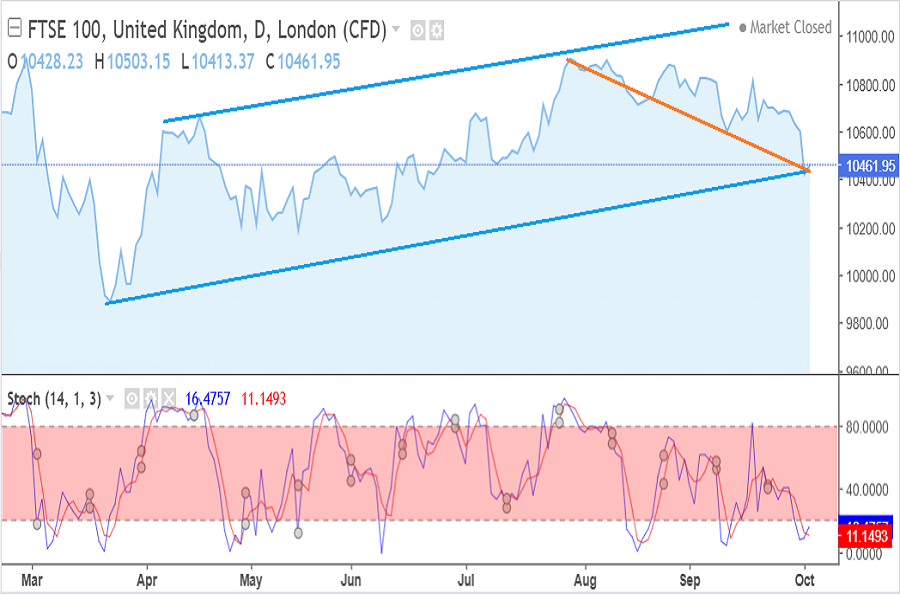
UK100 index October 2026
In London, the yield on 30-year gilts rose above 6% for the first time since 1998, and the FTSE 100 saw its worst week since April 2026. On the surface, nothing fundamental seems to have changed on the chart: we still see an upward trend, yet the support line has shifted significantly lower, and the formation of a downward trend is becoming increasingly apparent. Technical analysis indicators are still signaling a sell, though they are now in oversold territory.
US stock market on the start of October 2026 - weekly
Government bond yields rising remains the factor on the stock market.
The week's top stories in the USA weren't about macroeconomics, but rather "all-or-nothing" events: clinical trials, a court ruling, and a corporate split. The week's rally number one: Kodiak Sciences (Nasdaq: KOD) with 185.7% growth. The biotech firm’s stock nearly tripled following results from the Phase 3 DAYBREAK trial. Two of the company's drugs performed just as well as the market leader, Eylea. Their key advantage is the frequency of eye injections: more than half of the patients on Zenkuda required only one injection every six months, compared to injections every eight weeks for Eylea. Kodiak plans to file a registration application for Zenkuda as early as the fourth quarter. The week's biggest drop - Liquidia (Nasdaq: LQDA) whose stocks down by 58.18%. Another side of medal, another biotech company. The company lost more than half its value in a single day after losing a patent dispute. On September 30, a Delaware court ruled that Yutrepia - Liquidia’s inhaled drug for pulmonary hypertension and its flagship product, infringed on a patent held by competitor United Therapeutics. BTIG analysts immediately downgraded the stock. The company disagrees with the ruling and is preparing an appeal.
On the NYSE to the contrast nice to have non-biotech company - Wolfspeed (NYSE: WOLF)whose stocks added rose +28.05%. They represent semiconductor sector which has received a boost from Micron: its strong earnings report on September 30 confirmed demand for AI infrastructure and drove a rally across the entire sector. However, the primary beneficiary was Wolfspeed, a manufacturer of silicon carbide chips. Its shares gained over 10% on October 1 alone, driven by its own specific catalyst: the market launch of a new premium substrate designed to deliver a higher yield of usable chips.
US indices on the start of October: fast tech overview
S&P-500 index
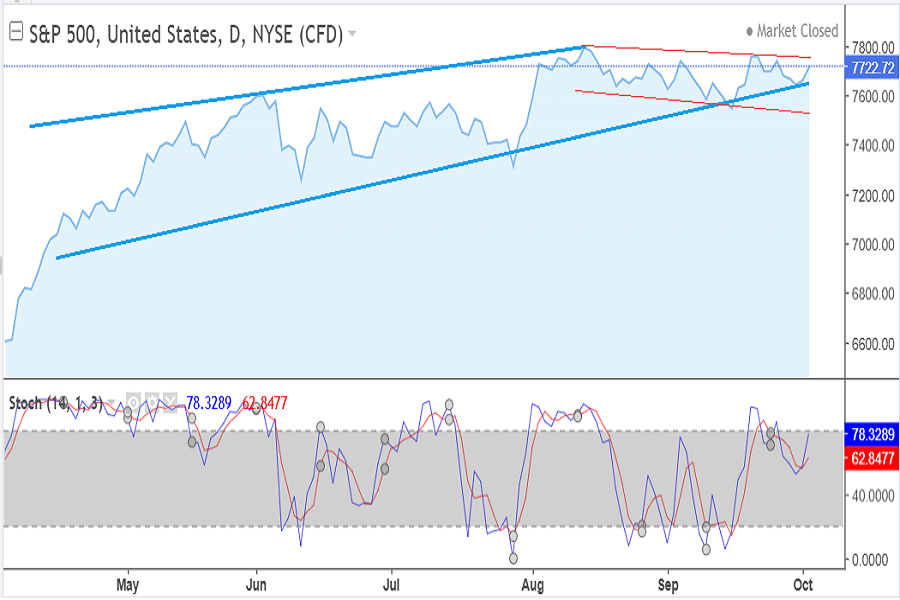
S&P500 October 2026
Wall Street was saved by a single weak report: the US economy added only 29,000 jobs in September, reducing the likelihood of a Federal Reserve rate hike in October, and indices recovered most of their losses on Friday. Thanks to this, the index held steady at last week's levels, but what does the chart show? It reveals not merely consolidation, but a gradual downward drift. The resistance line appears to have fully reversed direction. This could signal a trend reversal.
Technical analysis indicators are showing a buy signal, but we consider it false.
US30 index
US30 index October 2026
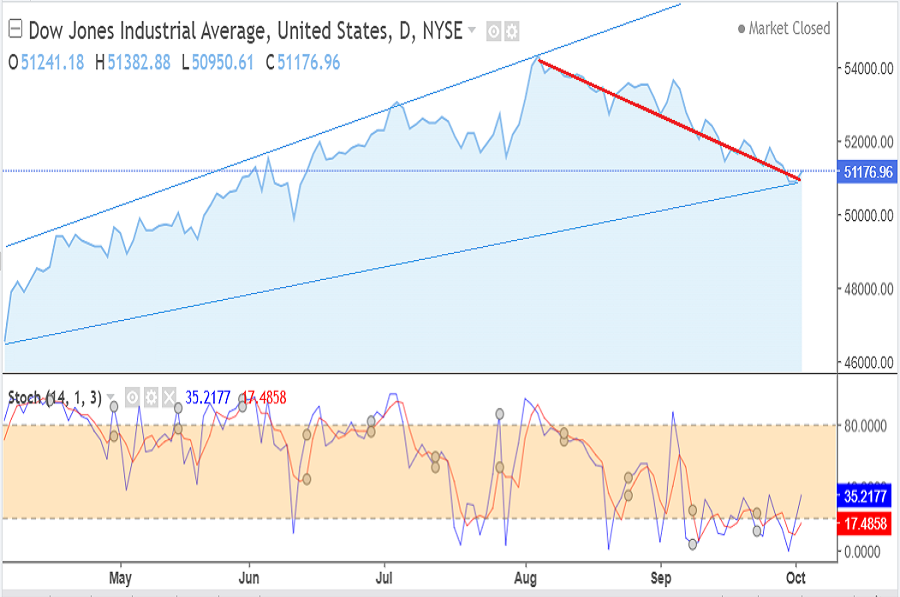
This chart most clearly illustrates a trend reversal, though it could also represent a price correction. Technical analysis cannot predict the future with 100% certainty; however, barring any changes, our confidence in the trend reversal hypothesis will grow over time. Technical indicators confirm our concerns regarding a continued downward move, though this does not constitute a forecast for an index decline next week. The stochastic oscillator, currently in oversold territory, signals a high probability of a near-term correction.
Nasdaq100 index tech review
NAS100 index October 2026
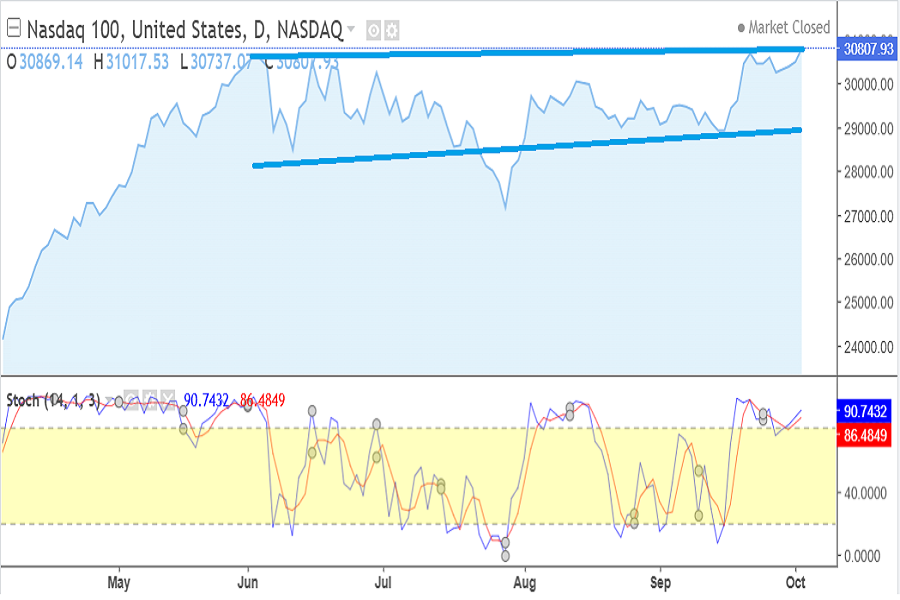
This NAS100 index shows significant consolidation; although it was one of the few to post gains over the past few weeks, the chart reveals the full picture: a highly volatile yet essentially sideways trend. Prices are currently testing the resistance level while remaining in overbought territory. Technical indicators signal a buy, suggesting a high probability of further growth. A key feature of this index is the absence of trend reversal signals or significant corrections, making a continued upward move to new highs the most likely scenario compared to other indices.
Key currencies on the start of October. Fast tech overview.
The overall narrative for all three pairs was the same: leading up to Friday, the dollar appreciated on the back of rising Treasury yields and bets on a Federal Reserve rate hike in October. On Friday, however, a weak employment report—showing a gain of 29,000 jobs against a consensus forecast of 90,000—slashed the probability of an October hike from roughly 70% to 25%, causing the dollar to pull back. Nevertheless, the currencies were unable to recoup their losses for the week.
EUR/USD tech review
The euro started the week on a downward trend. The week’s paradox was that Eurozone inflation failed to boost the euro. Preliminary data for September showed prices accelerating to 3.8% - up from 3.2% in August, marking a three-year high that exceeded forecasts. However, the rise was driven almost entirely by the energy sector, with energy prices surging 18.8% year-on-year. Core inflation, excluding energy and food, stood at just 2.5%. The market views this type of inflation as a tax on the economy rather than a trigger for a hawkish ECB policy stance, resulting in a muted reaction from the euro. Interest rate differentials continue to favor the dollar.
EUR/USD chart October 2026
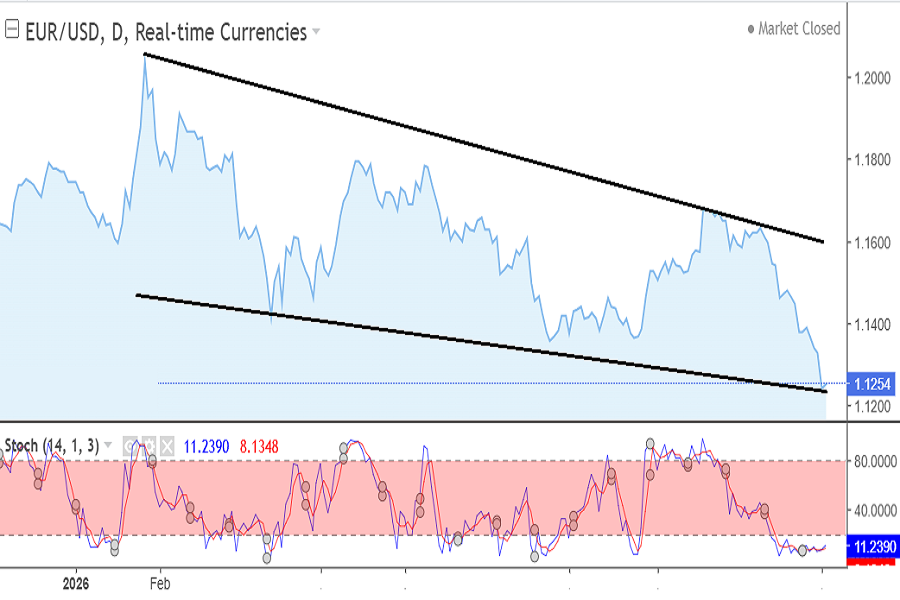
On the chart we can see downward trend as we forecasted before. The rates get to the oversold zone and we are waiting for the price correction especialling looking to the previous waves. It's time for a new one. Nevertheless, tech indicators show us confident Strong Sell signal in the long term perspective and we believe it's true.
USD/ZAR weekly review
USD/ZAR chart September 2026
This week, the stock market was unhappy with the weakening rand, although it was just as unhappy with the strong rand. So, no matter how you look at it, the rand is a bad value in the eyes of investors. Either way, the situation looks like this.
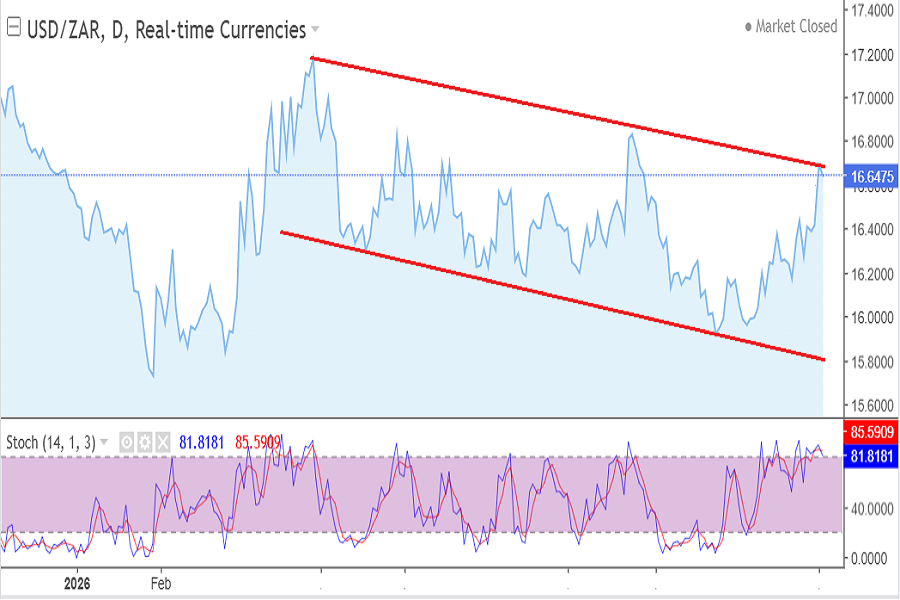
The rand lost nearly 2% over the week, marking its fourth consecutive week of decline. The sharpest drop occurred on Thursday, when the currency fell 1.5% to R16.67 against the dollar- its weakest level since late July. Ironically, local data this week was positive: producer price inflation slowed, the trade balance showed a surplus, and the manufacturing Purchasing Managers' Index (PMI) rose to 50.7. However, the global backdrop is currently more significant for the rand. Analysts at ETM Analytics note that high US yields are drawing capital away from emerging markets. This was compounded by a drop in the price of gold, one of South Africa's key exports.
Good news or at least hope for those who prefer stronger rand. On the chart we can see the rates within downward trend with no signs of reversal. After the price correction you have all rights to expect further rand strengthening. Tech indicators show us Strong buy signal in favor of USD but currently it looks like the rates are going to move downward according to the trend.
GBP/USD tech review
The pound also weakened amidst the sell-off in gilts, dropping to 1.3215 on Wednesday morning. Pressure stemmed from the slump in British government bonds with the yield on 30-year bonds hitting 6% for the first time in nearly three decades and nervousness ahead of the autumn budget. Weak housing market data added to the negative sentiment: Nationwide reported that house price growth slowed to 0.8% in September, down from 1.6% in August.
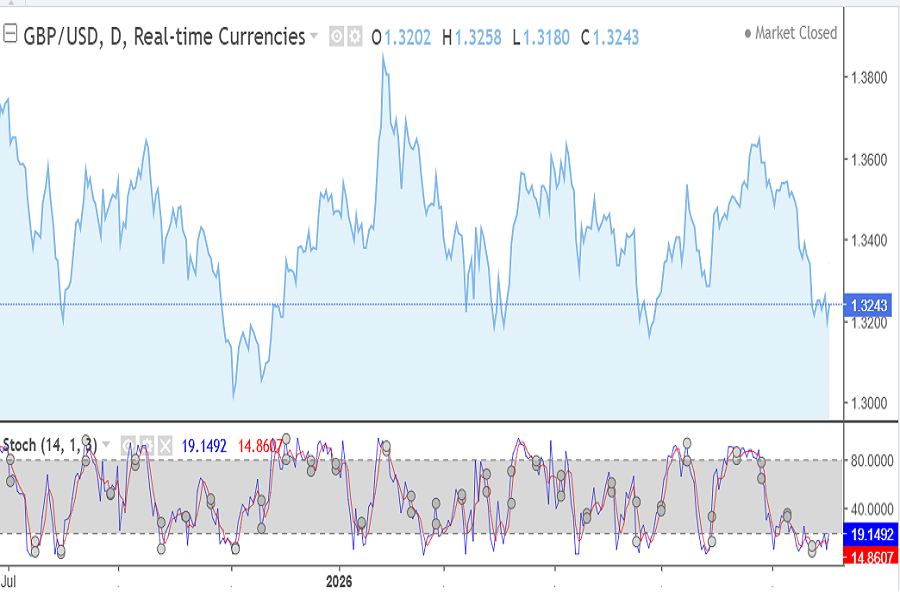
GBP/USD chart October 2026
GBP/USD chart is the most volatile but it's still looks downward. Hower we're waiting for upward wave according to the chart. Tech indicators show us Strong Sell signal but the oversold zone.
JSE & Global markets - on the start of October: Summary
Thus, despite the start of a new month, nothing has changed fundamentally in the stock markets. The only shifts involved the technology sector receding into the background - ceasing, for the time being, to act as a driving force for certain US indices and the influence of geopolitical factors.
The key question for the coming week is whether the pullback in yields will continue or the bond sell-off will return.

Stan Lytynsky
Stan Lytynsky is a well known financial expert with more than 1000 of market reviews. For the last 10 years he wrote reviews for different blogs and websites. In particular he worked for SuperForex and Zetradex forex brokers as a market analyst. Currently he is living in Canada and focused on the African market as the most promising and growing.
Comments
Loading comments…
Log in or sign up free to join the discussion.