JSE TOP40 index today. Fundamental review & forecast

John Nkosi
The flagship index of the Johannesburg Stock Exchange, the FTSE/JSE TOP-40, entered the second half of 2026 amidst elevated global volatility. As the key benchmark for South Africa's equity market, the index comprises the 40 largest companies by market capitalization, covering crucial economic sectors: Mining & Resources, Financial Institutions, and Technology giants (such as Naspers and Prosus).
August 2026 demonstrated strong dynamics. The index updated key local highs, supported by rising precious metal prices, the strengthening of the South African Rand (ZAR), and expectations of monetary easing by leading central banks.
August Index Analysis: Drivers, Dynamics, and Analyst Ratings
Throughout August, the JSE TOP-40 index showed a confident recovery, rising from local lows at the beginning of the month (~103,000 – 104,500 points) to a local peak above 111,000 points by August 28, before stabilizing around 108,500 – 110,500 points.
Key Growth Drivers:
- Resources & Precious Metals Sector: The rally in gold and platinum group metals (PGM) provided robust support to mining giants (Sibanye-Stillwater, Anglo American, Impala Platinum).
- Macroeconomics and ZAR: The stabilization of the Rand and the South African Reserve Bank's (SARB) pause on interest rate hikes supported the financial and retail sectors.
- Tech Sector: Positive dynamics in Tencent directly influenced heavyweights Naspers and Prosus, which account for a significant weight in the TOP-40 structure.
Analyst Consensus:
Most institutional analysts point to attractive fundamental valuations for South African equities based on P/E multiples relative to broader Emerging Markets (EM). The primary risk remains dependency on Chinese commodity demand and potential fluctuations in oil prices (Brent). The most important metric here - gold, platinum, coal prices. If you track sentiments around resources you track JSE index as well.
Technical Analysis
From a technical perspective, the daily chart of the JSE TOP-40 displays a sustained bullish momentum with the formation of trend continuation patterns.
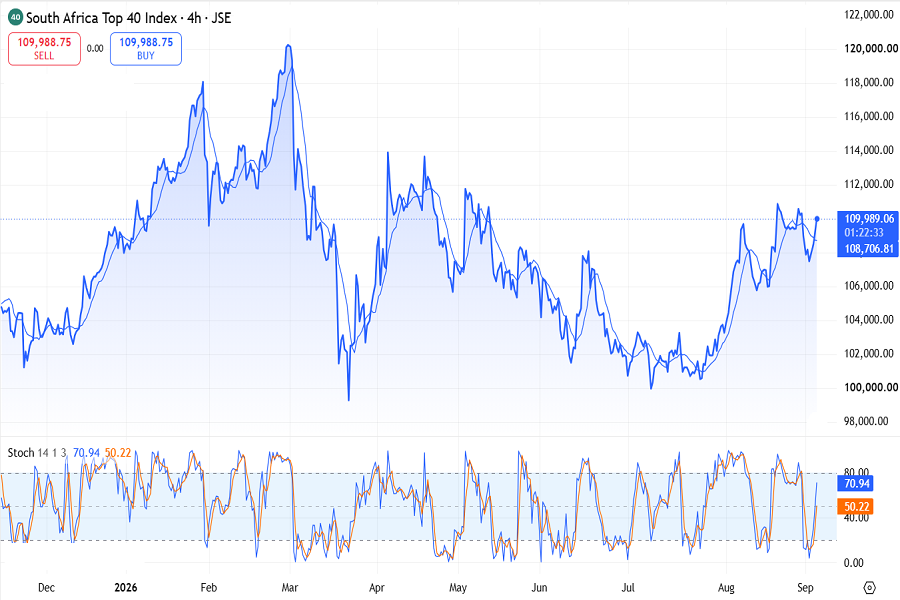
JSE TOP-40 chart, September 4
The chart shows that the trend reversed in August due to rising gold and coal prices. After minor price corrections at the end of August, the upward movement resumed. Technical analysis indicators are showing a buy signal. However, according to oscillators, there are no overbought or oversold conditions. There is every reason to expect further growth in September.
Key levels:
- Resistance: ~110,700–111,000 (August high), above – psychological zone 113,000–114,000 (May peak)
- Nearest support: 21-day EMA / round level 103,000–104,000
- Deeper support: June-July base around 99,800–100,000 – if the pullback intensifies
Forecast
September will be determined by two opposing factors for the Top 40.
: The Federal Reserve. The FOMC meeting on September 15-16 is currently balancing between holding the rate and raising it by 25 basis points (according to various estimates, 48-70% favor a hike as of late August-early September). A hard hike would strengthen the dollar and continue to put pressure on gold and the rand—a negative scenario for the index. Conversely, soft rhetoric or no rate hike could restore demand for gold and the Top 40 resource stocks.
: The US-Iran conflict. A new wave of escalation is keeping oil prices above $90-95 per barrel. For South Africa, this is a double-edged sword: on the one hand, rising oil prices pose an additional inflation risk for the consumer sector and the rand; On the other hand, ongoing geopolitical tensions could support demand for gold as a safe haven, partially offsetting the Fed's tighter approach.
Factor 1 remains reactive: the regulator has already indicated a readiness for a preemptive hike (May) and a hold despite above-target inflation (July). A new surge in oil prices, coupled with a hawkish Fed, reduces the scope for easing—the baseline scenario for September-October is holding the rate at 7%.
Base-Case Scenario (65% Probability)
Maintaining a favorable external background and stable commodity prices, the index will complete its corrective pause around 107,500 – 108,500 and resume its move toward 112,000 – 115,000 points through the end of Q3/Q4.
Bullish Scenario (20% Probability)
If monetary easing by the US Fed accelerates alongside interest rate cuts by the SARB, accompanied by a surge in Chinese demand, the index could break through historical highs toward a target range of 120,000 – 124,000 points.
Bearish Scenario (15% Probability)
Heightened geopolitical tensions, a sharp drop in metal prices, or weakness in the Rand could push the index back down to test support levels at 103,000 – 102,000 points.
Summary
The JSE TOP-40 index demonstrated robust results in August 2026, driven by a recovery in the resources sector and domestic market strengthening. The technical setup points to a continuation of the upward trend. Investors are advised to maintain long positions with a medium-term target of 112,000 – 115,000 points, taking advantage of local pullbacks for entry opportunities. Key points to watch in the coming weeks include US inflation data on September 10, the FOMC decision on September 16, and the dynamics of the US-Iran conflict, which has once again begun to weigh on oil and the rand.

John Nkosi
John is from South Africa and know local financial market as it's own. He works directly for Stocktalk and responsible for making regular JSE market news.
Comments
Loading comments…
Log in or sign up free to join the discussion.