Markets Weekly: JSE & Global. BIG review for August, Week 3


This week saw mixed performance on the stock markets of South Africa, the US, and the UK. Each exchange saw its own situation, from the LSE with near-zero movement in the UK100 index to the controversial South African rally, which was positive. We'll be examining each situation right now.
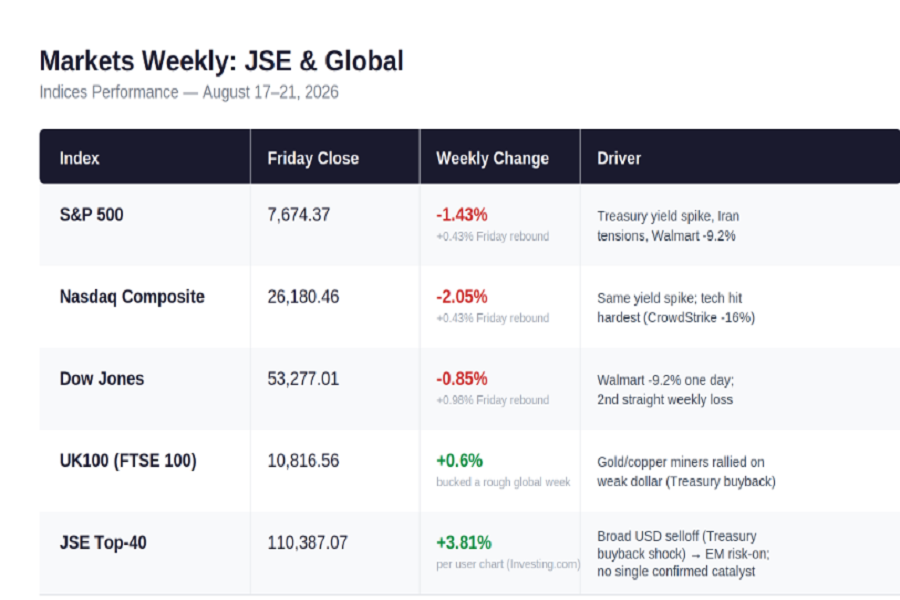
Weekly summary of the market indices in August 17-21, 2026
Slowing inflation (CPI rose by just 0.1% in July) and rising S&P business activity indices supported the IT sector and the S&P 500. However, weak retail sales (-0.6%) and a jump in Brent crude oil prices to over $90 capped overall growth. US indices were also under pressure due to a weakening dollar following reports of the Treasury's plan to double its government bond buyback program. The UK index stagnated despite relatively high volatility in individual company stocks. The problem is that they are not included in the UK100 index. The JSE TOP-40 index showed the highest growth and momentum. The index's mining companies rose amid rising base metal prices and a weaker dollar.
South African market overview
As mentioned above, the index showed decent growth, staying in the green on three of the five trading days. As for the overall market, things aren't so optimistic. Microcaps experienced a wave of sell-offs, making the red zone quite noticeable throughout the week. Putting their existence aside, there were no significant declines among systemic companies, but the rises were impressive.
(JSE: DRD), a world leader in gold mining from abandoned mines and recycled materials, published a strong financial report with operating profit up 83%. The company also announced a final dividend payment, up 200% from last year. This resulted in a 21.19% gain, demonstrating the most impressive stock market rally this week.
(JSE: TGA) also pleased investors with a strong report and a significant rally. Earnings per share rose 150% to 480c, and core earnings per share rose 467%. The market reaction was a more than 10% gain in shares in one day.
A negative development of the week was the announcement of Balwin Properties' plans to delist from the stock exchange by the end of October 2026, following its sale to a consortium led by PIC (Public Investment Corporation, the manager of the South African Government Pension Fund, GEPF).
US Market Weekly Overview
(Nasdaq: MRNA) was the biggest sensation of the week, Moderna in a week. Daily trading volume exceededjumping 130% (18 times the daily average). This was the release of positive data from a Phase III clinical trial (INTerpath-001) of a personalized mRNA cancer vaccine (intismeran autogene) in combination with Merck's Keytruda. The drug demonstrated a significant reduction in the risk of recurrence and metastasis in melanoma, setting a precedent for the successful use of mRNA platforms in oncology. This medical breakthrough also influenced investor demand for other companies. For example, 185 million shares (NASDAQ: TEM) rose nearly Tempus AI, Inc. as it partnered with Moderna to deliver its vaccine. Furthermore, the company published a strong financial report with growth across all metrics.
From NYSE we have original rally with a special story. Alpha Metallurgical Resources (NYSE: AMR) added +26.5% this week. This Tennessee-based company, headquartered in Bristol, Tennessee, specializes exclusively in supplying metallurgical coal to the mining industry. The company's price surged this week not due to financial reports or increased demand for its services, but due to insider trading. It was reported that Alpha Metallurgical Resources' director Kenneth S. Courtis purchased 15,000 shares this week, which was seen as a positive sign.
UK Market overview
On the London Stock Exchange, volatility for individual companies was impressive, but this did not affect companies included in the UK-100 index. While the healthcare sector was the most profitable on the US Stock Exchange, IT and mining companies were the winners on the UK Stock Exchange.
Kainos Group shares rose 33.1% in just one week
The company issued a trading update, stating that FY2027 results will be "comfortably ahead" of consensus, with revenue and profit expected to exceed even the upper limit of the company's guidance. For reference, the British IT company, based in Belfast, Northern Ireland, was founded in 1986. It creates digital platforms for the public sector, healthcare, and business, and is a partner of the Workday platform.
Indices tech performance for the week 3 of August
1 JSE TOP-40 index
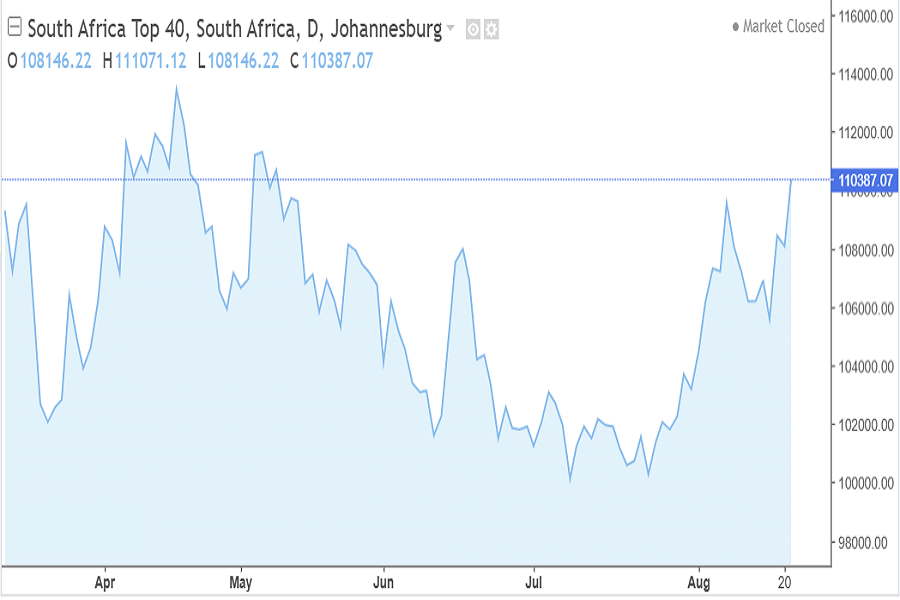
JSE TOP-40 August 17-21 2026
The index posted the highest gains, outperforming key US and UK indices, reflecting the weakening dollar and rising precious metals prices. The upward movement is consistent with the new uptrend that began a month ago. From this perspective, there's every chance of seeing further growth. This is confirmed by technical analysis indicators, which are giving us a Strong BUY signal.
2 S&P index for the week 3 of August
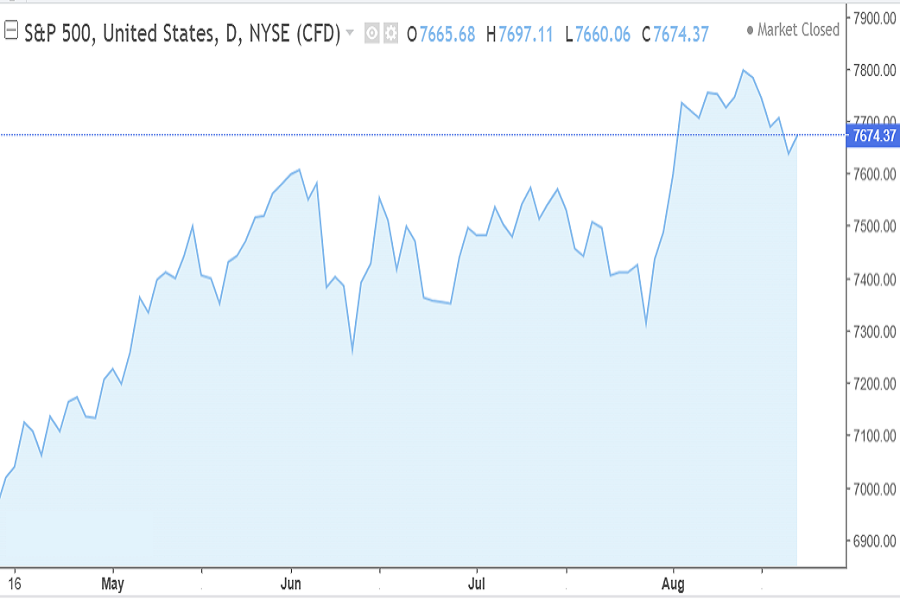
S&P index for August 17-21 2026
As expected, the index retreated from its peak, declining for almost the entire week. This price correction is unlikely to last long. Perhaps we'll see a new upward momentum as early as next week.
3 Nasdaq Composite weekly overview
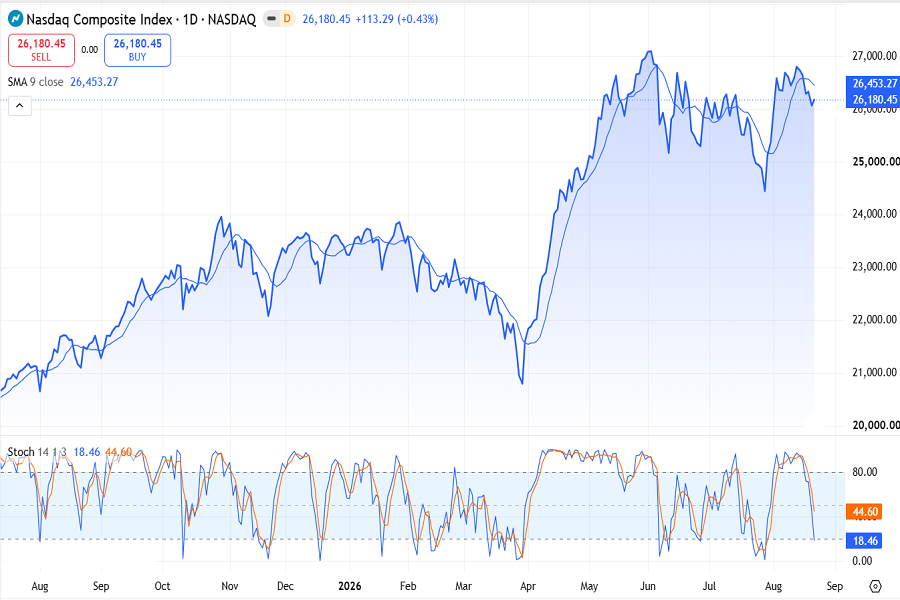
Nasdaq Composite index August 17-21 2026
The S&P is traditionally in a similar situation: a retreat from highs with a high probability of a renewed upward movement. However, in this case, the decline was 0.6% greater, and technical indicators are showing a more confident buy signal.
4 DOW JONES index in August 17 - 21
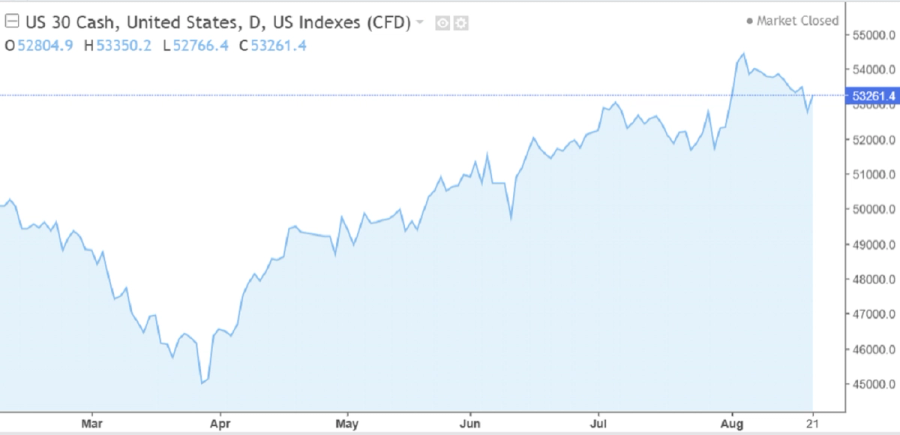
US30 (DOW30) index, August 17-21 2026
The US30 index is closing its second consecutive week lower. Technical indicators appear somewhat confused, but the Stochastic Oscilator shows what's visible to the naked eye: some oversold conditions as a result of a prolonged correction. This chart still appears to be trending upward and could surge higher soon.
5 UK100 index weekly review
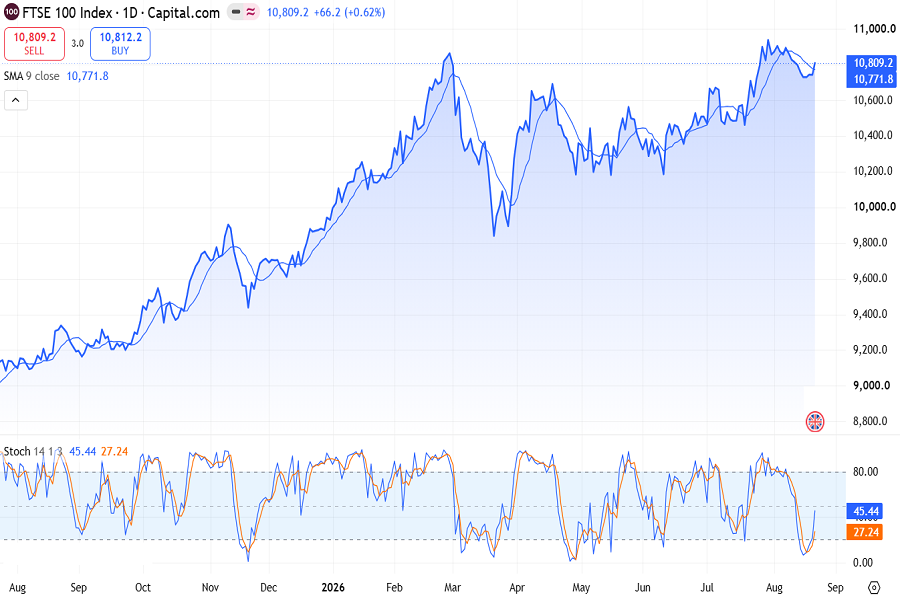
UK 100 chart August 17-21 2026 overview
The UK100 index is slightly outperforming its US counterparts in its recovery. Thanks to a strong Friday trading day, the index closed slightly higher. It appears the price correction is complete. Technical analysis indicators are still mixed, but the Stochastic Oscilator is already sensing a change in direction and is turning up.
Key Currencies for the third week of August 2026
1 EUR/USD
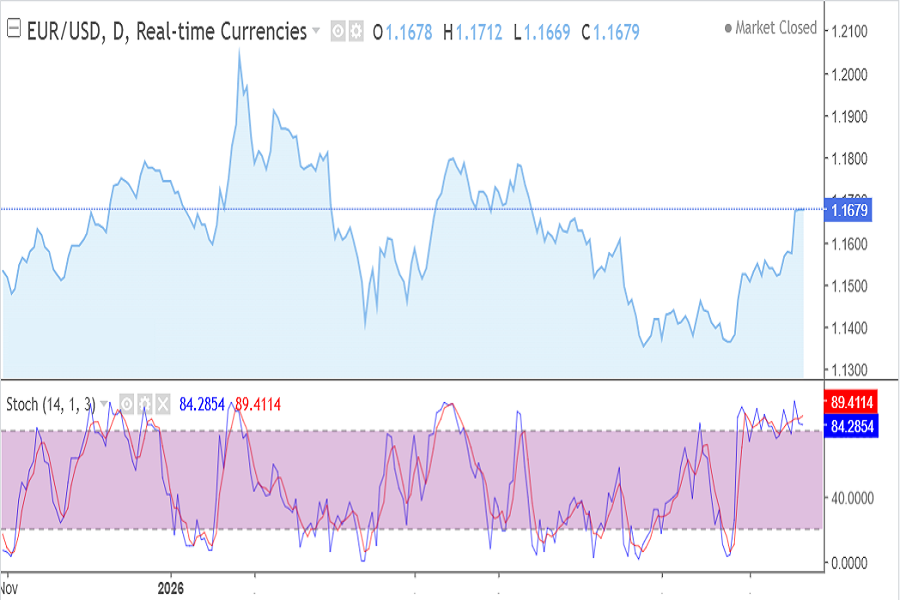
EUR/USD chart for August 2026, 17-21
The euro held onto the gains it made following the release of data showing a slowdown in US consumer inflation (CPI 0.1% MoM). Easing expectations of tough talk from the Federal Reserve allowed the euro to consolidate at local highs, despite continued weakness in Germany's industrial sector.
The dollar, meanwhile, received mixed signals from rising jobless claims, government bond purchase plans, and strong business activity indices. As a result, the US dollar weakened against most other currencies for the week.
On the chart you can see the rates are in the overbought zone according to Stochastic oscilator. Next week there's all chances to have a price correction. Although tech indicators show us a BUY signal. No contradictions here. This signal can be considered correct in the medium term.
2 USD/ZAR
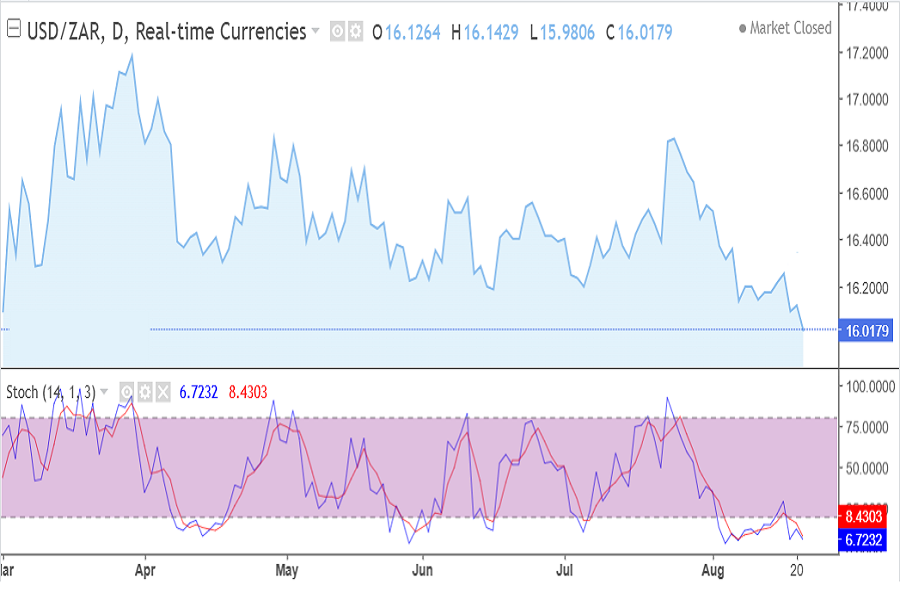
USD/ZAR chart, August 2026, 17-21
This currency pair already reached 4 year minimums and seems like able for more. The South African rand received strong support from the commodity market. A historic rally in precious metals (gold above $4,600/oz) and copper locally improved South Africa's trade balance. Combined with declining global appetite for the dollar, this allowed the pair to test the lower boundary of its monthly range.
Despite the rates in the overbought zone according Stochastic oscilator, most of tech indicators show us further Strong Sell signal. What does it mean? Likely we will have price correction and then new try to explore many years minimums continue.
3. USD/JPY
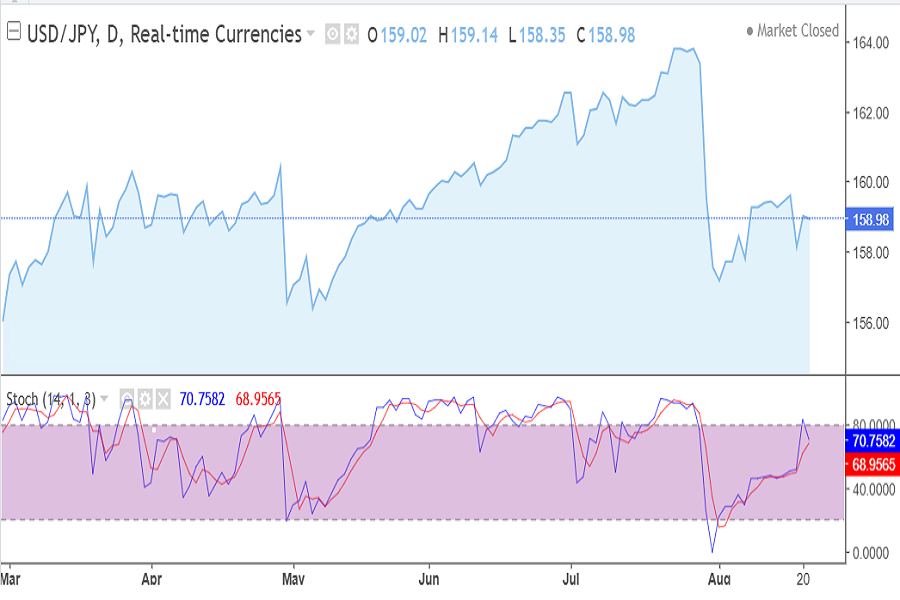
USD/JPY chart August 2026 17-21
The Japanese yen has recovered some of its losses from earlier this month, but the carry trade continues to weigh. The market is ignoring the Bank of Japan's verbal interventions, awaiting clear signals on the path of US interest rates before a reversal.
In this case, the chart shows further upward movement in favor of the dollar after another test of the support line, while technical analysis indicators are in different directions.
Summary
Thus, the main drivers of global stock markets were the weakening dollar, rising precious metal prices, and breakthroughs in medicine and IT. Strong corporate earnings reports this time proved a weaker signal for investors than potential profits from new vaccines or insider reports of management share purchases. Even on the South African Stock Exchange, strong corporate earnings reports propelled companies to the top only due to their enhanced mining industry affiliation.

Stan Lytynsky
Stan Lytynsky is a well known financial expert with more than 1000 of market reviews. For the last 10 years he wrote reviews for different blogs and websites. In particular he worked for SuperForex and Zetradex forex brokers as a market analyst. Currently he is living in Canada and focused on the African market as the most promising and growing.
Comments
Loading comments…
Log in or sign up free to join the discussion.