Lecture 15 (Chapter 2). Multiples and comparison
In this lecture continue learning how to read every single thing in every single corporate report.

Thandiwe Mbeki
Published · Updated

Valuation Multiples: P/E, P/S, PEG, P/BV, and EV/EBITDA
Why multiples exist
Comparing companies by their share price alone is meaningless. A R50 share isn't automatically "cheaper" than a R500 one, since it depends entirely on what you get for that price (earnings, sales, assets). Valuation multiples solve this by expressing price relative to some underlying financial metric, letting you compare companies of completely different sizes on equal footing, and compare a single company's current valuation against its own history.
No single multiple tells the whole story. Each one highlights a different angle, and each has blind spots the others cover. This lecture walks through the five most commonly used.
P/E — Price-to-Earnings
P/E = Share Price ÷ Earnings Per Share (EPS)
This is the most widely quoted multiple, and answers a simple question: how many rand am I paying for each rand of the company's annual profit? A P/E of 15 means investors are paying R15 for every R1 of current annual earnings.
Standard Bank Group (JSE: SBK), for example, has traded around a trailing P/E of roughly 10.5x in 2026 , with its PE Ratio (TTM) sitting near a three-year high relative to its own 10-year range. Useful context, since 10.5x on its own tells you little without knowing whether that's high or low for this specific company and its sector.
What it's good for: quick, intuitive comparison within the same industry, where accounting practices and capital structures are broadly similar.
Its blind spot: P/E says nothing about growth. A P/E of 25 could be expensive for a slow-growing company, or perfectly reasonable for one growing earnings at 30% a year. It's also distorted by one-off items (a large asset sale or write-down can spike or crash EPS for a single period), and it's meaningless for companies with no profit at all.
PEG — Price/Earnings-to-Growth
PEG = P/E Ratio ÷ Expected Annual EPS Growth Rate (%)
PEG directly fixes P/E's biggest weakness by dividing it by the company's expected earnings growth rate. A commonly used rule of thumb: a PEG around 1.0 suggests a share is fairly priced relative to its growth; below 1.0 can suggest undervaluation relative to growth prospects; above 1.0 can suggest the price has run ahead of realistic growth expectations.
Continuing the Standard Bank example, its PEG ratio has recently sat close to 0.95 , alongside a trailing P/E around 10.6x and a forward P/E of roughly 9.5x - a PEG near 1 here suggests the market isn't pricing in outsized growth expectations, consistent with a large, mature bank rather than a fast-growing smaller company.
Its blind spot: PEG depends entirely on a growth forecast and forecasts are opinions, not facts. Two analysts covering the same company can produce meaningfully different PEG ratios simply by disagreeing on next year's earnings growth.
P/S — Price-to-Sales
P/S = Market Capitalisation ÷ Total Revenue (or, per share: Share Price ÷ Revenue per Share)
P/S compares price to revenue rather than profit. This makes it especially useful for companies that aren't yet profitable - a young, fast-growing business can have no earnings at all (making P/E impossible to calculate) while still generating real, growing revenue.
Its blind spot: revenue says nothing about how efficiently a company turns sales into actual profit. Two companies with identical P/S ratios can have wildly different profitability. One might run at a healthy 20% net margin, the other might be losing money on every sale. P/S is best used to compare companies within the same industry, where margin structures tend to be broadly comparable.
P/BV — Price-to-Book Value
P/BV = Share Price ÷ Book Value per Share, where Book Value = Total Assets − Total Liabilities.
P/BV compares the market's valuation of a company to the accounting value of what it actually owns, net of what it owes. A P/BV below 1.0 means the market is valuing the company at less than its net asset value on paper which can signal either a genuine bargain or, just as often, a market correctly pricing in problems the balance sheet doesn't fully capture (bad loans not yet written off, declining asset quality, structural business decline).
What it's good for: particularly relevant for asset-heavy businesses - banks, insurers, property companies, where the balance sheet closely reflects the real economic value of the business. It's far less useful for asset-light businesses (technology or services companies), where most of the real value sits in things a balance sheet doesn't capture well, like brands or intellectual property.
EV/EBITDA — Enterprise Value to EBITDA
This is the most complete of the five, because it accounts for debt, which the other multiples largely ignore.
Enterprise Value (EV) = Market Capitalisation + Total Debt − Cash and Cash Equivalents
EV represents the total cost of acquiring the entire business: not just its shares, but also taking on its debt (while netting off the cash sitting on its balance sheet). This is compared to EBITDA (Earnings Before Interest, Tax, Depreciation, and Amortisation) - a proxy for the company's core operating cash-generating ability, before financing structure and accounting choices around depreciation distort the picture.
EV/EBITDA = Enterprise Value ÷ EBITDA
What it's good for: comparing companies with very different levels of debt fairly. Two companies with identical P/E ratios can look completely different once you account for the fact that one is funded mostly by equity and the other is carrying substantial debt - EV/EBITDA captures that difference; P/E doesn't. It's the multiple most commonly used in company valuations for mergers and acquisitions, precisely because it reflects the true cost of taking over a business, debt included.
Its blind spot: EBITDA excludes real costs. Depreciation reflects genuine wear on equipment that eventually needs replacing, and interest is a real cash cost for indebted companies. A company can look far healthier on an EV/EBITDA basis than it actually is if it carries heavy debt or requires constant capital reinvestment.
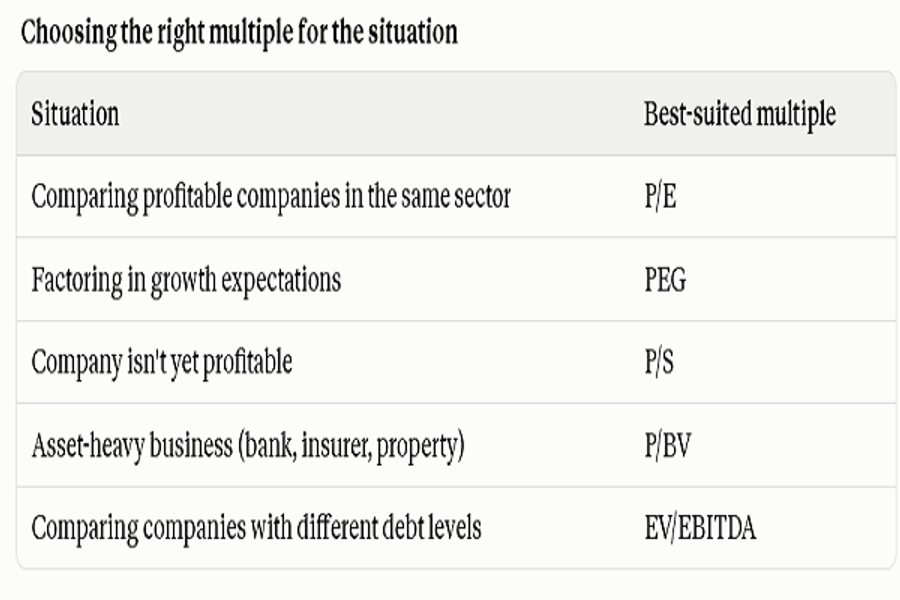
In practice, experienced investors rarely rely on just one multiple. They look at two or three together, since each one covers a blind spot the others miss. We'll put this into practice with real JSE company comparisons in Lecture 5.3.
Key takeaways
- Valuation multiples let you compare companies of different sizes by expressing price relative to earnings, sales, assets, or cash flow.
- P/E is the most common multiple but ignores growth; PEG corrects for that by dividing P/E by the expected growth rate.
- P/S works even for unprofitable companies but ignores profitability entirely.
- P/BV is most meaningful for asset-heavy businesses like banks and property companies.
- EV/EBITDA is the most complete single multiple, since it accounts for a company's debt, making it the standard for comparing companies with different capital structures.
Efficiency and Leverage Multiples: ROE, ROA, and D/E
Moving from "how expensive" to "how good"
The multiples from the last lecture (P/E, PEG, P/S, P/BV, EV/EBITDA) all answer some version of "how expensive is this share relative to X?" This lecture covers a different question entirely: how good is this company at actually generating profit from what it has? These are efficiency ratios, and they tell you about the underlying business quality - independent of what price the market currently puts on it.
ROE — Return on Equity
ROE = Net Profit ÷ Shareholders' Equity
ROE measures how much profit a company generates for every rand of shareholders' money invested in it. It's often treated as the single best headline measure of management's effectiveness at deploying the capital shareholders have entrusted to them - a consistently high ROE, sustained over years, is a strong signal of a well-run, competitively advantaged business.
Shoprite Holdings (JSE: SHP), for example, has recently reported an ROE around 25.9%, alongside a return on invested capital (ROIC) of roughly 15.3%. A meaningfully higher ROE than a bank like Standard Bank, which sits closer to 18%. That gap doesn't automatically mean Shoprite is the "better" business. It partly reflects how differently capitalised a retailer and a bank naturally are, which is exactly why ROE needs to be read alongside the next ratio.
ROA — Return on Assets
ROA = Net Profit ÷ Total Assets
ROA measures profit generated relative to everything the company owns — not just the shareholders' portion, but assets funded by debt too. This makes ROA a more complete efficiency measure than ROE in one important respect: it can't be inflated by leverage.
Shoprite's ROA sits considerably lower than its ROE - around 5.5% , reflecting how ROA measures returns relative to the company's full asset base rather than just shareholder equity. That large gap between a ~26% ROE and a ~5.5% ROA is itself informative: it tells you that debt-funded assets are doing a lot of the work in generating Shoprite's headline ROE figure.
Why the gap between ROE and ROA matters
This is the single most important lesson in this lecture: ROE can be artificially inflated by debt. Consider two companies with identical net profit and identical total assets but Company A funds itself with 80% debt, 20% equity, while Company B funds itself with 20% debt, 80% equity. Company A's ROE will look dramatically higher, purely because the profit is being divided by a much smaller equity base - not because it's actually a more efficient or better-run business.
This is exactly why an impressive ROE figure should never be read in isolation. It needs to be checked against D/E, the ratio that tells you how much of that return is coming from genuine operational efficiency versus simply from leverage.
D/E — Debt-to-Equity
D/E = Total Debt ÷ Total Shareholders' Equity
D/E tells you how a company is funded: how much of its capital structure comes from debt (borrowed money that must be repaid, with interest, regardless of how the business performs) versus equity (shareholders' money, with no repayment obligation).
Shoprite's D/E currently sits around 1.87 , alongside a current ratio of 1.16 - meaning it carries roughly R1.87 of debt for every R1 of shareholder equity. For a large, cash-generative retailer with predictable revenue, a D/E in this range is generally considered manageable, since stable, recurring sales make debt easier to service reliably. The same D/E ratio on a smaller, more cyclical business. One, whose revenue can swing sharply with economic conditions would represent meaningfully more risk, since a bad year could make debt servicing genuinely difficult.
A useful habit: when you see an unusually high ROE, check the D/E alongside it. A high ROE paired with conservative debt levels is a much stronger signal of genuine business quality than a high ROE propped up by heavy leverage. The latter can look impressive in good times and turn dangerous quickly in a downturn.
Sector context matters enormously
Banks are a special case worth flagging directly: comparing a bank's D/E to a retailer's using the same yardstick doesn't work, because taking deposits which shows up as a liability on a bank's balance sheet - is the core of a bank's business model, not financial distress. This is exactly why, in Module 3, we noted that different types of businesses naturally produce very different-looking balance sheets. The same principle applies here: always compare ROE, ROA, and D/E against companies in the same sector, never across completely different business models.
Key takeaways
- ROE measures profit relative to shareholder equity; ROA measures profit relative to total assets, comparing the two reveals how much of a company's return comes from leverage rather than operational efficiency.
- A high ROE should always be checked against D/E before being read as a sign of a genuinely well-run business.
- D/E measures how a company is funded - debt versus equity and what counts as a "healthy" level depends heavily on how stable and predictable the company's revenue is.
- Sector context is essential: banks, retailers, and asset-heavy industrials naturally carry very different debt and efficiency profiles, and should only be compared within their own sector, not across sectors.
Practice: Comparing JSE Companies by Multiples
Following the advice above, always compare within the same sector. We'll line up South Africa's three largest banks: Standard Bank (SBK), FirstRand (FSR), and Absa (ABG).
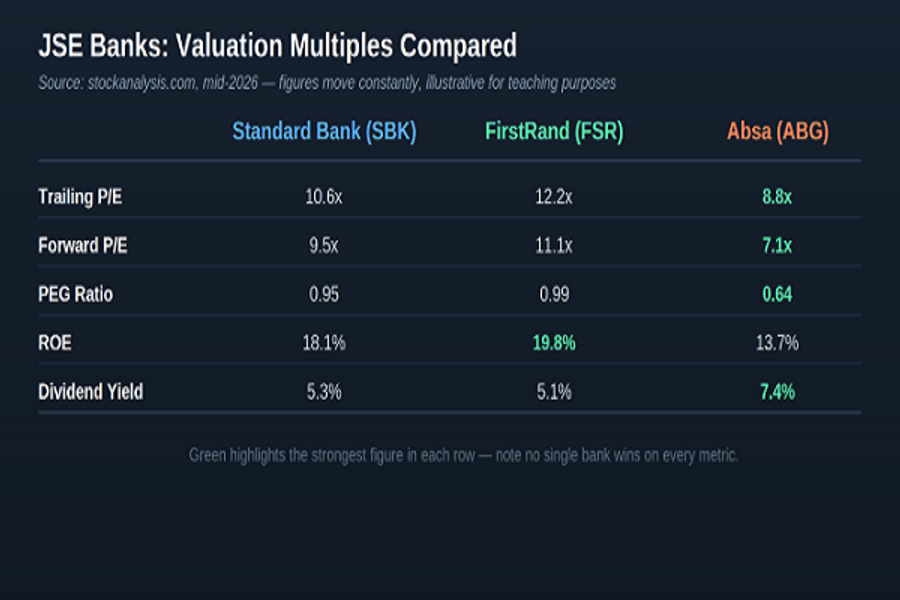
Bank multiples comparison
Reading the table like an investor, not a spreadsheet
Absa looks cheapest on paper - the lowest trailing P/E (8.8x), lowest forward P/E (7.1x), and lowest PEG (0.64) of the three. Taken alone, a screener sorted purely by "lowest P/E" would flag Absa as the obvious pick. But Lecture 5.2's warning applies directly here: a cheap multiple paired with a weaker ROE is a different story than a cheap multiple on a genuinely strong business. Absa's ROE, at 13.7%, is meaningfully below both peers. The market isn't necessarily "wrong" about Absa being cheap; it may simply be pricing in that Absa currently converts shareholder equity into profit less efficiently than FirstRand or Standard Bank do. A low PEG here could reflect real undervaluation, or it could reflect the market correctly demanding a lower price for a lower-quality earnings stream. The multiple alone can't tell you which.
FirstRand looks the most expensive on both P/E measures, but it also posts the highest ROE (19.8%) of the three. This is the flip side of the same coin: paying a higher multiple for a business that's demonstrably better at generating returns on shareholder capital isn't automatically "overpaying". It may simply be the market correctly rewarding quality. Whether that premium is worth paying is a judgement call, not something the multiple decides for you.
Standard Bank sits in the middle on almost every measure - a PEG close to 1.0, a solid but not class-leading ROE, and a dividend yield roughly matching FirstRand's. This kind of "balanced" profile is common for large, mature companies where no single metric stands out dramatically in either direction.
Absa's dividend yield (7.4%) is the highest of the three but a high yield isn't automatically a gift. It can result from a genuinely generous payout policy, or it can simply be arithmetic - a lower share price (relative to earnings) mechanically produces a higher yield on the same dividend amount. Given Absa's lower ROE and P/E here, its higher yield is at least partly a reflection of the market pricing the shares more cautiously, not necessarily a sign of a more shareholder-friendly company.
The actual skill: no metric wins alone
Notice that no single bank "wins" on every metric and that's the normal, expected outcome, not a flaw in the data. If one company dominated on every multiple simultaneously, it would usually mean the market hadn't yet noticed something obvious. A rare situation, not the everyday reality of investing in large, well-covered companies like these three banks.
A reasonable process looks like this:
- Start with the cheapest-looking multiple (here, Absa's low P/E and PEG) as a candidate worth investigating further is not a conclusion.
- Check it against a quality measure (ROE) to see whether the low price reflects genuine undervaluation or a genuinely weaker business.
- Bring in dividend yield last, and always ask why it's high or low, rather than treating a high number as automatically good.
- Read the qualitative story behind the numbers. Recent earnings trends, management commentary, sector-specific risks since multiples describe where a company stands today, not why it got there or where it's heading.
This is exactly the discipline that separates screening a stock (which a spreadsheet can do in seconds) from actually evaluating one (which still requires judgement).
Key takeaways
- Comparing multiples across peers reveals trade-offs a single number hides. A low P/E paired with a low ROE tells a different story than a low P/E on a strong business.
- No company typically leads on every multiple at once; that's a feature of efficient, well-covered markets, not a sign something's broken.
- A high dividend yield should always be checked against valuation and profitability metrics before being read as a positive signal on its own.
- The practical process: identify what looks cheap, check it against quality (ROE), question yield rather than celebrate it, then bring in the qualitative story.
- Multiples are a starting point for investigation, not a final verdict — real evaluation still requires judgement.
Track your portfolio
Log your holdings and see performance against the JSE All Share.
Go to your portfolio