Lecture 14 (Chapter 2). Macro Analysis.
In this lecture we will talk about macroeconomic indicators: what they show, why investors are following them.

Thandiwe Mbeki
Published · Updated

Economic Cycles, GDP, and PMI
Why macro matters for a stock picker?
So far, this course has focused on individual companies - their financial statements, their instruments. But every company operates inside a larger economic environment, and that environment expands and contracts in a repeating pattern. Understanding roughly where the economy sits in that pattern helps explain why entire sectors move together, even when nothing company-specific has changed.
The economic cycle: four phases
Economies don't grow in a straight line: they move through a repeating cycle of expansion and contraction, typically described in four phases:
1. Expansion is economic activity is growing: businesses are hiring, consumers are spending, output is rising. This is generally the most favourable phase for share prices, particularly for cyclical sectors like retail, banking, and industrials.
2. Peak is a growth reaches its maximum rate and begins to level off. Inflation often becomes a concern here, as demand starts outpacing supply.
3. Contraction (or recession) is economic activity declines: falling output, rising unemployment, weaker consumer spending. Defensive sectors (like healthcare, food retail, and utilities — businesses people keep spending on regardless of the economy) tend to hold up relatively better here than cyclical ones.
4. Trough are activity bottoms out and begins turning upward again, setting up the next expansion phase.
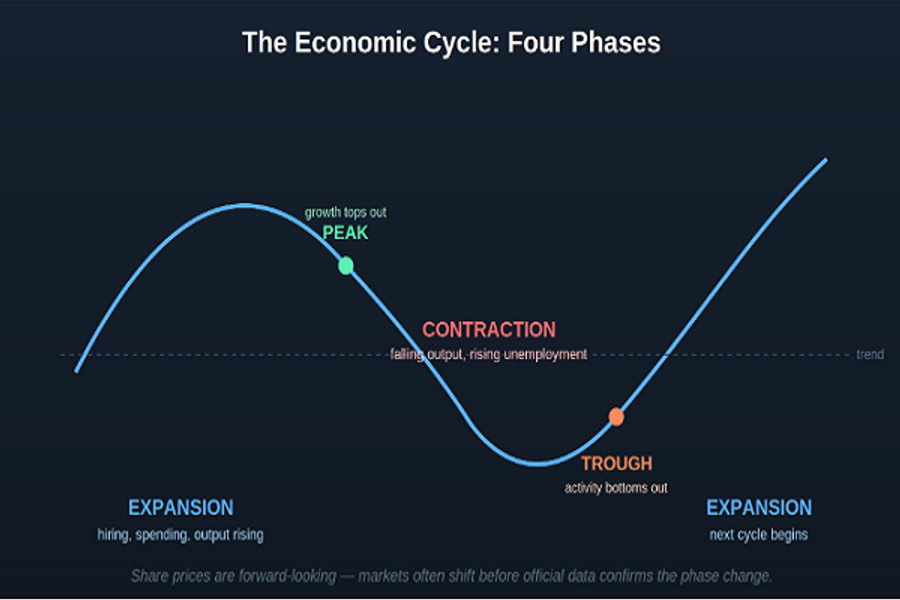
The Economic Cycle: 4 phases
Markets don't wait for a phase to be officially confirmed before reacting. Share prices are forward-looking, so investors often start pricing in a shift (like an approaching recession or recovery) months before the official data catches up. This is part of why the stock market is sometimes described as a leading indicator of the economy, rather than a mirror of it.
GDP: the scoreboard for the whole economy
Gross Domestic Product (GDP) is the total value of all goods and services produced in a country over a given period. It's the single most-watched measure of economic size and growth, usually reported as a percentage change from the previous quarter or year.
- GDP growth (positive %) signals expansion - generally supportive of corporate earnings and share prices.
- GDP contraction (negative %), especially across two consecutive quarters, is the commonly used technical definition of a recession in many economies.
South Africa's GDP figures are released quarterly by Statistics South Africa (Stats SA). For a JSE investor, South African GDP trends matter most for domestically focused companies (banks, retailers, telecoms), while globally diversified JSE giants like Naspers or BHP Group can be more influenced by growth trends in the economies where they actually generate revenue is a useful reminder that "the JSE" and "the South African economy" aren't the same thing.
PMI: a faster, forward-looking read on the economy
GDP has one major drawback for investors: it's backward-looking and released with a lag, often a month or more after the quarter it covers ends. The Purchasing Managers' Index (PMI) fills that gap.
PMI is a monthly survey of purchasing managers at businesses (typically split into manufacturing and services PMI), asking about current conditions: new orders, production levels, employment, supplier delivery times, and inventories. The results are compiled into a single number:
- PMI above 50 - the sector is expanding
- PMI below 50 - the sector is contracting
- PMI at exactly 50 - no change from the previous month
Because it's a survey of business activity happening right now, PMI is released quickly: usually within days of month-end, making it one of the most-watched "real-time" indicators of economic direction, well ahead of GDP confirming the same trend weeks or months later.
Reading these together, practically
A useful habit for a JSE investor: when South Africa's PMI has been trending below 50 for several consecutive months, it's often an early warning that GDP figures (released later) may come in weak too, which historically tends to weigh more heavily on cyclical, domestically focused JSE sectors (banks, retailers, construction) than on defensive or globally diversified ones. Conversely, a PMI climbing back above 50 after a stretch below it can be an early signal of recovery, well before it shows up in slower-moving GDP data.
Neither indicator predicts share prices with precision, and macro data should never be the sole basis for a stock decision but ignoring the broader economic backdrop entirely means missing a real driver of why entire groups of shares sometimes move together, independent of company-specific news.
Key takeaways
- Economies move through four repeating phases: expansion, peak, contraction, and trough.
- GDP measures total economic output, but is backward-looking and released with a lag.
- PMI is a monthly survey-based indicator, released quickly, that leads GDP in signalling economic direction - above 50 means expansion, below 50 means contraction.
- Cyclical JSE sectors (banks, retailers, industrials) are typically more sensitive to the economic cycle than defensive ones (healthcare, food retail, utilities).
- Markets are forward-looking and often price in a cycle shift before official data confirms it.
Interest Rates, Quantitative Easing, and Employment
Interest rates: the price of money itself
Every economy has a benchmark cost of borrowing, set by its central bank. In South Africa, that's the repo rate, set by the South African Reserve Bank (SARB) is the rate at which the SARB lends to commercial banks. This single number cascades through the entire economy: banks set their prime lending rate (what they charge good clients) at a margin above the repo rate, and from there it touches everything from home loan rates to vehicle finance to company overdrafts.
As of its most recent decision, the SARB held the repo rate at 7%, with the prime lending rate at 10.5% - a decision made at the July 23, 2026 meeting, though the split vote within the Monetary Policy Committee left the door open to a further hike. This followed a series of cuts from late 2024 through early 2026, before the SARB raised rates in May 2026 for the first time in three years. Rates change over time, so treat this as a snapshot rather than a fixed number but the mechanism behind it doesn't change.
Why rate changes matter so much for share prices
A rate change ripples through markets in several distinct ways at once:
- Borrowing gets more expensive. Consumers with less disposable income after servicing debt spend less elsewhere. A direct headwind for retailers and consumer-facing companies.
- Company debt costs rise. Highly-leveraged businesses, and particularly REITs (which typically carry significant debt to fund property portfolios), feel this most directly through squeezed margins and costlier expansion.
- Bonds become more attractive. When "safe" government bonds start yielding more, some investor capital rotates out of shares and into bonds, since the extra risk of holding shares now needs to compensate for a higher risk-free alternative.
- Valuations get discounted more harshly. Professional valuation models discount a company's expected future earnings back to today's value using an interest-rate-linked discount rate. A higher rate shrinks the present value of earnings expected years from now which is why high-growth companies (whose value is weighted more toward the distant future) tend to fall harder on rate hikes than mature, steady-earning businesses.
- Banks often benefit — partially. Lenders like Standard Bank can typically earn a wider margin between what they pay depositors and what they charge borrowers when rates rise, though this can be partly offset if higher rates also push more borrowers into default.
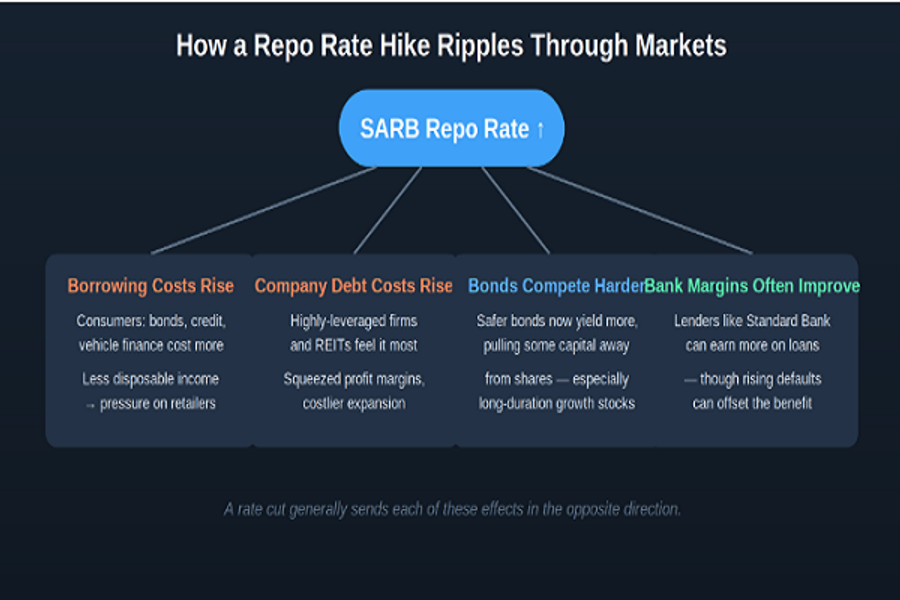
A rate cut generally pushes each of these effects in reverse - cheaper borrowing, cash and bonds becoming less attractive relative to shares, and valuations getting a lift from a lower discount rate.
Quantitative easing and tightening
Quantitative Easing (QE) is a tool major central banks (most notably the US Federal Reserve and the European Central Bank) use when interest rate cuts alone aren't enough: the central bank creates money to buy large quantities of bonds and other assets, pushing down longer-term borrowing costs and pumping liquidity directly into the financial system. Investors flush with cheap money and low bond yields often go looking for better returns elsewhere, including in shares. This "hunt for yield" was a major driver behind the global market rally following the extraordinary QE programmes launched during the 2020 pandemic.
Quantitative Tightening (QT) is the reverse: central banks shrink their balance sheets by letting bonds mature without reinvesting the proceeds, or by selling assets outright, draining liquidity back out of the system.
South Africa's own central bank doesn't run large-scale QE or QT the way the Fed or ECB do but as an emerging market, the JSE is still very much affected by global QE/QT cycles. When major central banks are in QE mode and global liquidity is abundant, capital tends to flow more freely into emerging markets like South Africa, supporting both the rand and JSE share prices. When those same central banks shift to QT, that capital often flows back toward developed markets, which can pressure the rand and put downward pressure on JSE valuations even when nothing has changed domestically. This is one of the clearest examples of why South African investors need to watch global central bank policy, not just SARB decisions.
Employment: the clearest read on consumer strength
The unemployment rate measures the share of the labour force actively looking for work but unable to find it. It matters to investors because employed people spend money. Employment trends are a direct proxy for consumer spending power, which feeds straight into the revenue of retailers, banks, telecoms, and virtually every consumer-facing JSE company.
South Africa's official unemployment rate stood at 33.6% in the second quarter of 2026, up from 32.7% in the first quarter - reflecting an increase of 345,000 unemployed persons alongside a decrease of 16,000 employed persons compared to the prior quarter. Youth unemployment (ages 15–34) is considerably higher, rising 1.5 percentage points to 47.4% over the same period. These figures are structurally very high by global standards, and it's worth understanding this as a persistent backdrop to the South African economy, rather than an unusual, temporary condition, unlike in many developed markets, where a shift of even one or two percentage points is treated as a major event, in South Africa investors tend to watch the direction and pace of change (rising vs. falling, accelerating vs. stabilising) more closely than the absolute level itself.
Putting it together
Rates, QE/QT, and employment don't move independently. They're deeply connected. Persistently high unemployment can encourage the SARB toward rate cuts to stimulate spending and hiring, while accelerating inflation (often driven by a weaker rand or rising import costs) can force it toward hikes even when unemployment is high, creating a genuine policy trade-off. This is exactly the kind of tension you'll see referenced constantly in South African financial media, and understanding it gives real context to headlines about SARB decisions, rather than reading them as isolated news events.
Key takeaways
- The SARB repo rate sets the base cost of borrowing across the entire economy; it currently stands at 7%, having been raised in May 2026 for the first time in three years.
- Higher rates squeeze consumer and company borrowing costs, make bonds more competitive with shares, and discount growth-stock valuations harder than mature ones while often benefiting bank margins.
- QE floods markets with liquidity and tends to lift risk assets like shares; QT drains it and tends to do the opposite and South Africa is exposed to global QE/QT cycles even without running large programmes of its own.
- South Africa's unemployment rate (33.6% in Q2 2026, with youth unemployment at 47.4%) is structurally high. Investors watch its direction and pace of change more than the absolute level.
- Rates, liquidity, and employment interact and sometimes conflict, which is why central bank decisions are rarely simple.
Explore StockTalk tools
Charts, screeners, and analyst estimates — put what you just learned to work.
Explore tools