Lecture 13 (Chapter 2). Financial Statements
In this lecture we will talk about financial statements which publish companies. You will find out why they impact on the stock value and what is inside?

Thandiwe Mbeki
Published · Updated

Balance Sheet and Income Statement: How to Read Them?
Why financial statements matter?
Every JSE-listed company is legally required to publish financial statements: usually every six months (interim results) and annually (final results). These documents are the closest thing you'll get to an objective report card on how a business is actually performing, as opposed to how its share price is moving on any given day. Learning to read them, even at a basic level, is what separates "I like this company" from "I understand this company."
There are three core financial statements: the balance sheet, the income statement (also called the profit & loss statement, or P&L), and the cash flow statement. This lecture covers the first two; cash flow gets its own lecture next, since it deserves focused attention.
The balance sheet: a snapshot at one moment in time
The balance sheet answers one question: what does the company own, and who has a claim on it? It's called a "snapshot" because, unlike the income statement, it reflects a single moment - the last day of the reporting period, not activity over a period of time.
Every balance sheet rests on one unbreakable equation:
Assets = Liabilities + Equity
This isn't a coincidence or a rule someone made up. It's mathematically true by definition. Everything a company owns (its assets) was funded either by money it owes to others (liabilities) or money that belongs to its owners (equity). The balance sheet must always balance, which is where the name comes from.
Assets are split into two groups:
- Current assets - things expected to be converted to cash within a year: cash itself, money owed by customers (receivables), and inventory
- Non-current assets - longer-term holdings: property, equipment, vehicles, and long-term investments
Liabilities are split the same way:
- Current liabilities are obligations due within a year: money owed to suppliers (payables), short-term loans
- Non-current liabilities are a longer-term obligations: long-term debt, bonds issued by the company
Equity is what's left over for shareholders once liabilities are subtracted from assets. It includes share capital (money originally raised from investors) and retained earnings (accumulated profit the company has kept rather than paid out as dividends).
Different types of businesses have very different-looking balance sheets. A bank like Standard Bank, for example, carries loans made to customers as a major asset and customer deposits as a major liability - a structure that looks nothing like a retailer, whose balance sheet is dominated by inventory and store property instead. Neither structure is "better". It simply reflects what kind of business it is.
Here's the structure laid out visually:
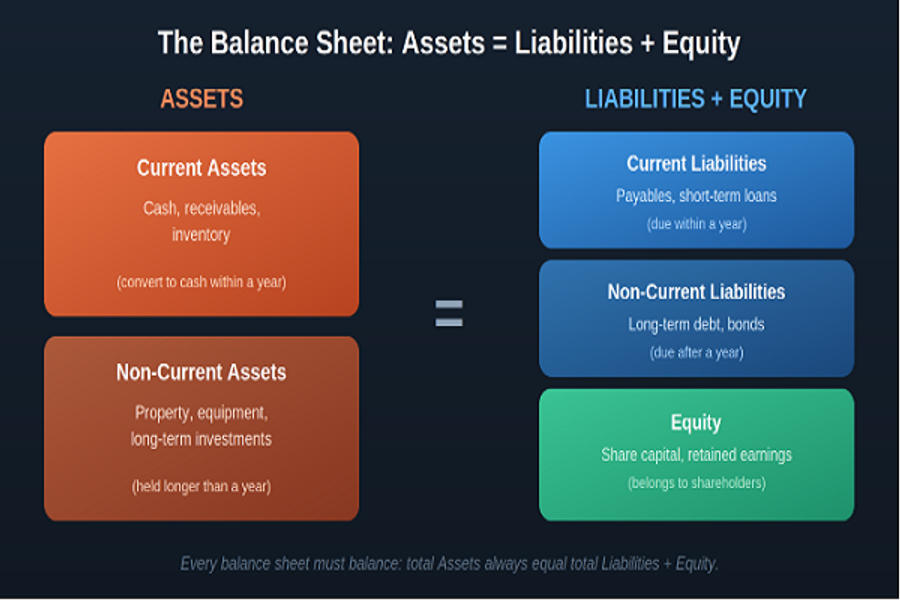
The balance sheet aseets = Liabilities + Equity
The income statement: performance over a period
While the balance sheet is a snapshot, the income statement tells the story of a period: usually six or twelve months. It answers a different question: how much did the company earn, and what did it cost to earn it?
The statement flows in a specific top-to-bottom sequence, with each line subtracting a cost from the line above:
- Revenue - total sales, before any costs are deducted (also called turnover)
- Cost of Sales (COGS) - the direct cost of producing or buying what was sold
- Gross Profit = Revenue − Cost of Sales
- Operating Expenses - salaries, rent, marketing, administration — the cost of running the business day-to-day
- Operating Profit (EBIT = Earnings Before Interest and Tax) = Gross Profit − Operating Expenses
- Interest Expense is the cost of servicing debt
- Profit Before Tax = Operating Profit − Interest
- Tax - corporate income tax (currently 27% in South Africa)
- Net Profit (the "bottom line") = Profit Before Tax − Tax
Each of these numbers also gives rise to a margin. That line expressed as a percentage of revenue which is often more useful than the rand amount itself, because it lets you compare companies of very different sizes. A gross margin of 36% tells you something meaningful regardless of whether the company made R10 million or R10 billion in revenue.
Here's a worked, illustrative example showing how the numbers flow from top to bottom:
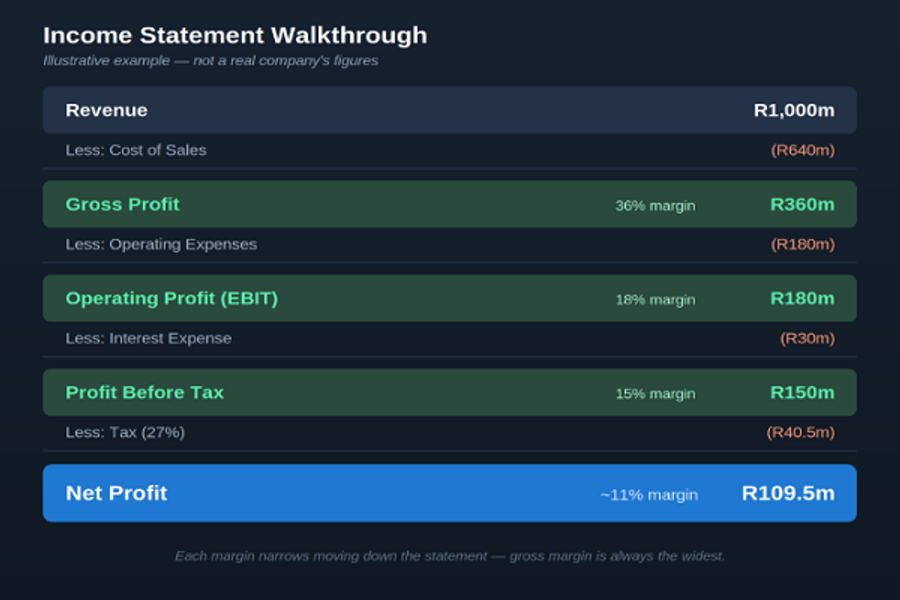
Income Statement
Notice how each margin narrows as you move down the statement - gross margin is always the widest, since it's the earliest and least-diluted measure of profitability, and net margin is always the narrowest, since it's what's left after every single cost has been deducted.
Reading them together
The balance sheet and income statement are connected: a company's net profit for the period (from the income statement) flows into retained earnings on the balance sheet - assuming it isn't fully paid out as dividends. Reading both together gives you a far more complete picture than either alone: the income statement tells you whether the business is currently profitable, while the balance sheet tells you how it's funded and what it actually owns to back that up.
Key takeaways
- The balance sheet is a snapshot of what a company owns and who has a claim on it: Assets = Liabilities + Equity, always.
- The income statement tells the story of a period, flowing from Revenue down to Net Profit, with a cost deducted at each step.
- Margins (gross, operating, net) matter more than absolute rand figures when comparing companies of different sizes.
- Different industries naturally have very different-looking balance sheets and margin profiles. That's normal, not a red flag.
- The two statements connect: net profit from the income statement feeds into retained earnings on the balance sheet.
Cash Flow Statement, and Reading All Three Statements Together
Why profit and cash are not the same thing?
A company can report a healthy net profit on its income statement and still run dangerously low on cash. This surprises a lot of beginners, but it comes down to how accounting actually works: the income statement uses accrual accounting. Revenue is recorded when it's earned (e.g., when a sale is made), not necessarily when cash actually lands in the bank. A company can book a large sale to a customer who takes 90 days to pay, showing that revenue as profit today, while the cash itself is still outstanding.
The income statement also includes non-cash expenses like depreciation (spreading the cost of equipment over its useful life). This reduces reported profit without any cash actually leaving the business in that period.
This is exactly why the cash flow statement exists: it strips away accounting timing and non-cash entries, and shows you what actually happened to the company's cash balance during the period. Among experienced investors, there's a common saying that captures this well: "profit is opinion, cash is fact."
The three sections of the cash flow statement
Every cash flow statement is broken into three distinct sources of cash movement:
1. Operating Activities - cash generated (or consumed) by the core, everyday business. This section typically starts with net profit, then adjusts it: adding back non-cash expenses like depreciation, and accounting for changes in working capital (did receivables grow, tying up cash in unpaid customer invoices? Did payables grow, effectively giving the company more time to pay its own suppliers?).
2. Investing Activities - cash spent on, or received from, long-term assets: buying new equipment or property (capital expenditure, or capex), acquiring another company, or buying and selling long-term investments. This section is usually negative for a growing company. That's normal, since growth requires ongoing investment.
3. Financing Activities - cash flowing between the company and its lenders or shareholders: raising or repaying debt, issuing new shares, paying dividends, or buying back shares.
Adding all three sections together gives you the net change in cash for the period: the actual movement in the company's bank balance.
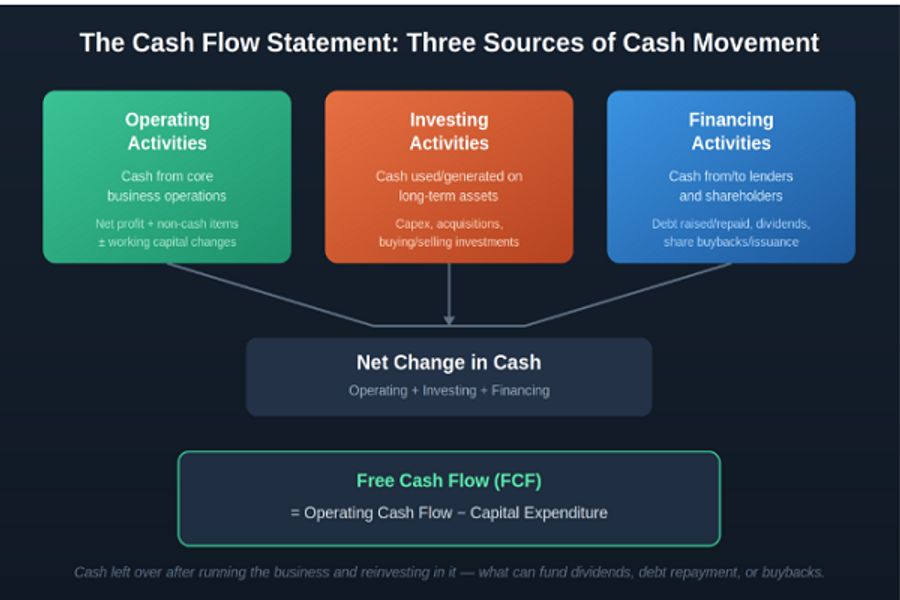
The cash flow Statement
Free Cash Flow: the number many investors watch closest
Free Cash Flow (FCF) = Operating Cash Flow − Capital Expenditure
FCF represents the cash a company generates from its operations after paying for the reinvestment needed just to keep running (and growing) the business. It's the pool of money genuinely available to pay dividends, reduce debt, buy back shares, or fund expansion beyond what's already committed. Many experienced investors treat FCF as a more reliable gauge of financial health than net profit alone, precisely because it can't be shaped by non-cash accounting choices the way reported profit sometimes can.
A red flag worth knowing: profit up, operating cash flow down
One of the more useful, beginner-friendly checks you can do with these statements: compare the trend in net profit to the trend in operating cash flow over a few reporting periods. If net profit is climbing steadily but operating cash flow is flat or falling, it's worth asking why? It can be an early sign that receivables are piling up (customers aren't actually paying), that inventory is building faster than it's selling, or, in rarer and more serious cases, that reported earnings are being managed aggressively. It doesn't automatically mean something is wrong, but it's a reasonable prompt to read the notes to the financial statements more carefully before investing.
Reading all three statements as one picture
By now you've met all three core statements, and each answers a different question:
- Income Statement: was the business profitable this period, and how?
- Balance Sheet: what does it own, and how is that funded, as of today?
- Cash Flow Statement: where did the actual cash come from, and where did it go?
No single statement tells the full story on its own. A company can look profitable on the income statement, well-capitalised on the balance sheet, yet still be quietly burning cash or the reverse, showing modest accounting profit while generating strong, healthy cash flow. Reading all three together, even briefly, before investing in a company is one of the simplest habits that separates a considered decision from a guess based on a headline number.
Key takeaways
- Net profit and cash are different concepts. Accrual accounting and non-cash items like depreciation can make them diverge significantly.
- The cash flow statement has three sections: Operating, Investing, and Financing. Together they explain the period's net change in cash.
- Free Cash Flow (Operating Cash Flow − Capex) shows what's genuinely available to fund dividends, debt repayment, or buybacks.
- Profit rising while operating cash flow falls is worth investigating further, not an automatic red flag, but a prompt to dig deeper.
- The balance sheet, income statement, and cash flow statement are most useful read together, not in isolation.