Lecture 8 (Chapter 2). Portfolio and Risk management
This lecture is about how to built effective portfolio

Thandiwe Mbeki
Published · Updated

Building a Portfolio: Diversification and Risk Profile
Diversification: reducing risk without necessarily reducing return
Diversification means spreading investments across assets that don't all move in the same direction at the same time for the same reasons. The mathematical concept behind this is correlation. How closely two assets' prices tend to move together. Shares and bonds, as covered in Lecture 2, often respond differently to the same economic event (a rate hike, for instance, can pressure share valuations while lifting newly issued bond yields), combining assets with imperfect correlation smooths a portfolio's overall ride, without necessarily sacrificing long-term return, since losses in one holding can be offset by gains in another.
Diversification works across several dimensions at once:
- Asset class — shares, bonds, property, cash
- Sector — banks, retailers, resources, technology, healthcare
- Geography — South African vs. offshore exposure
Why geography deserves special attention for a South African investor
This is worth dwelling on, because it's a diversification dimension many local investors under-weight. South Africa represents a small fraction of total global stock market capitalisation, and the JSE itself is fairly concentrated. A handful of large companies and a few dominant sectors (financials, resources, and a small number of global consumer names) make up a disproportionate share of the index. An investor holding only JSE shares is exposed not just to individual company risk, but to broader South Africa-specific risk: currency moves, domestic political developments, and the health of the local economy all at once. The exact opposite of diversification.
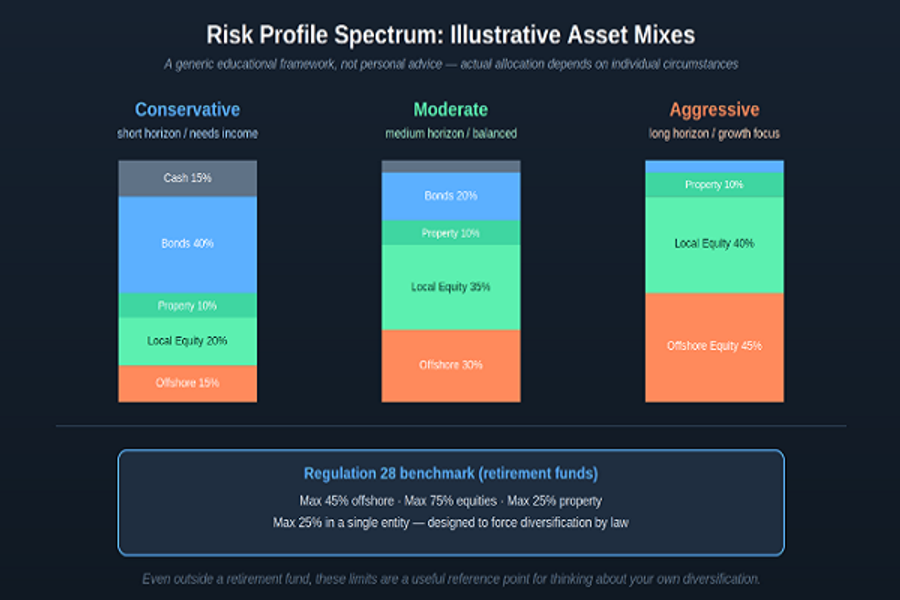
Even South Africa's own retirement fund regulator has effectively endorsed offshore diversification as prudent practice. Regulation 28 of the Pension Funds Act, which governs how retirement funds may allocate their assets, currently allows retirement funds to hold up to 45% of their capital offshore in aggregate, alongside limits of 75% in equities, 25% in property, and no more than 25% of the fund in any single entity. A set of legally enforced diversification rules designed specifically to prevent the kind of concentrated risk described above. You aren't bound by Regulation 28 outside a retirement fund, but its limits remain a genuinely useful reference point for thinking about your own diversification, even in a discretionary brokerage or tax-free savings account.
Risk profile: what actually determines how much risk to take
A risk profile describes how much investment volatility an investor can reasonably take on, shaped by three practical factors:
- Time horizon - how long before the money is needed. A longer horizon gives a portfolio more time to recover from a downturn before that money must be withdrawn, which generally supports a higher allocation to (more volatile, higher-expected-return) equities.
- Need for income vs. growth - an investor relying on portfolio income now (in retirement, for example) generally needs more stability and predictable cash flow than one still building wealth for a goal decades away.
- Emotional capacity for volatility - even with a long time horizon, an investor who is likely to panic-sell during a sharp downturn may be better served by a somewhat more conservative mix than pure time horizon alone would suggest, since a portfolio abandoned at the worst moment defeats its own purpose.
An illustrative framework. Not a personal recommendation
The diagram below shows a generic illustration of how a Conservative, Moderate, and Aggressive risk profile might differ in asset mix. A useful mental model, not a specific recommendation, since the right allocation for any individual depends on their own circumstances (and is worth discussing with a licensed financial advisor for anything beyond a rough starting framework).
Risk profile allocation
Notice the pattern moving left to right: as the time horizon lengthens and the need for near-term stability falls away, cash and bonds shrink while equity and offshore exposure grow. The logic generalises even though the exact percentages here are illustrative, not prescriptive.
Key takeaways
- Diversification spreads risk across assets with imperfect correlation across asset class, sector, and geography. Smoothing returns without necessarily sacrificing long-term performance.
- South African investors carry meaningful concentration risk if invested purely in JSE-listed assets, given the exchange's relatively small global weight and sector concentration.
- Regulation 28's 45% offshore allowance and single-entity limits, while specific to retirement funds, offer a useful general benchmark for thinking about your own diversification.
- Risk profile is shaped by time horizon, income needs, and genuine emotional tolerance for volatility - not just a personality label.
- Asset allocation frameworks (Conservative/Moderate/Aggressive) are useful starting mental models, not substitutes for advice tailored to individual circumstances.
Money Management: How Much to Risk Per Trade?
The uncomfortable truth: being right isn't enough
A common beginner assumption is that successful investing is mainly about picking winners. In reality, professional traders and investors care just as much - often more - about how much is at risk on any single position as they do about being right. A strategy that's correct 70% of the time can still destroy an account if the 30% of losing trades are sized too large; a strategy that's correct only 40% of the time can be genuinely profitable if losses are kept small and consistent. Money management is what determines which outcome you get.
Why the math of losses is so unforgiving?
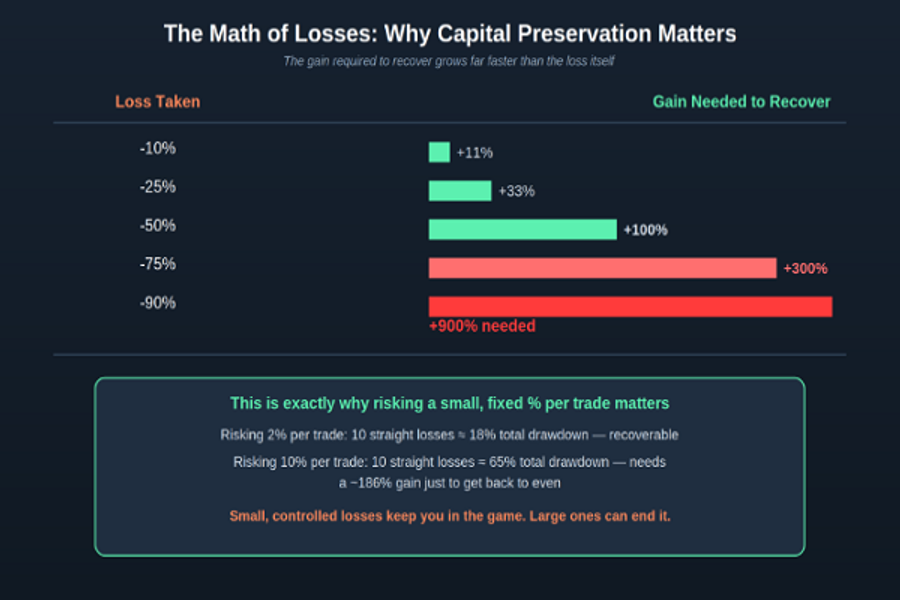
Here's the core insight that makes disciplined position sizing non-negotiable: the percentage gain needed to recover from a loss grows far faster than the loss itself.
Loss recovery math
A 10% loss only needs an 11% gain to break even manageable. But a 50% loss needs a full 100% gain just to get back to where you started, and a 90% loss needs a 900% gain - a mountain most portfolios never climb back out of. This asymmetry is precisely why avoiding large losses matters more than chasing large wins.
The 1–2% rule
A widely used guideline among disciplined traders and investors: never risk more than 1–2% of total portfolio capital on a single position. "Risk" here specifically means the amount you'd actually lose if the trade goes wrong and you exit at your predetermined stop-loss level - not the full size of the position itself.
This single rule is what keeps a string of losing trades from becoming account-threatening. As the diagram above shows: risking 2% per trade, ten consecutive losses produces roughly an 18% drawdown - painful, but entirely recoverable. Risking 10% per trade, the same ten losses produce a roughly 65% drawdown, requiring a near-187% gain just to break even - a very different, much darker outcome from the exact same losing streak.
Position sizing: putting the rule into practice
To apply the 1–2% rule, you need to know your position size - how many shares to actually buy based on where you'd exit if wrong:
Position Size = (Account Risk Amount) ÷ (Entry Price − Stop-Loss Price)
Say you have a R100,000 portfolio and you're willing to risk 2% (R2,000) on a trade. You plan to buy a share at R50, with a stop-loss at R45 (meaning you'd exit if the price fell to R45, accepting a R5-per-share loss). Your position size would be R2,000 ÷ R5 = 400 shares - a R20,000 position, not your entire portfolio, sized specifically so that hitting your stop-loss costs exactly your intended 2%, no more.
Notice this means position size isn't a fixed rand amount you decide upfront. It's derived from how far your stop-loss sits from your entry price. A tighter stop allows a larger position for the same dollar risk; a wider stop requires a smaller position.
Risk/reward ratio: is the trade worth taking at all?
Before sizing a position, it's worth checking whether the trade's potential reward justifies its risk. The risk/reward ratio compares the distance to your stop-loss (potential loss) against the distance to your target (potential gain). A common guideline is seeking a ratio of at least 1:2 - risking R1 to potentially make R2 or more.
This matters because it changes how often you actually need to be right to come out ahead overall. With a 1:2 risk/reward ratio, you can be wrong on 60% of trades and still profit over time, because your average winner is worth twice your average loser. This is exactly why professional traders often talk more about risk/reward and win-loss math than about being "right". A disciplined process with unfavourable odds on any single trade can still be profitable in aggregate.
Key takeaways
- Being right on a trade matters less than how much you risk when you're wrong - money management, not prediction accuracy, is what protects an account long-term.
- Losses and the gains needed to recover from them are asymmetric: a 50% loss needs a 100% gain to recover, and a 90% loss needs a 900% gain.
- The 1–2% rule - never risking more than 1–2% of total capital on a single position, keeps a losing streak survivable rather than account-threatening.
- Position size is derived from the distance between your entry price and your stop-loss, not decided as a fixed rand amount upfront.
- A favourable risk/reward ratio (e.g., 1:2) means you can be wrong more often than you're right and still be profitable overall.
Track your portfolio
Log your holdings and see performance against the JSE All Share.
Go to your portfolio