JSE & Global Markets Digest. September 2026 - week 2


Geopolitics took center stage this week: the escalation of the conflict involving Israel, the US, and Iran, combined with a sharp spike in oil prices, drove the movement of virtually all key markets simultaneously. For the first time in a long while, the JSE, Wall Street, and London markets all closed in the red. A rare occurrence given the differing causes: profit-taking in South Africa’s resource sector following an extraordinary August rally, versus a direct reaction in the US and UK to rising oil prices, surging bond yields, and growing expectations of central bank rate hikes.
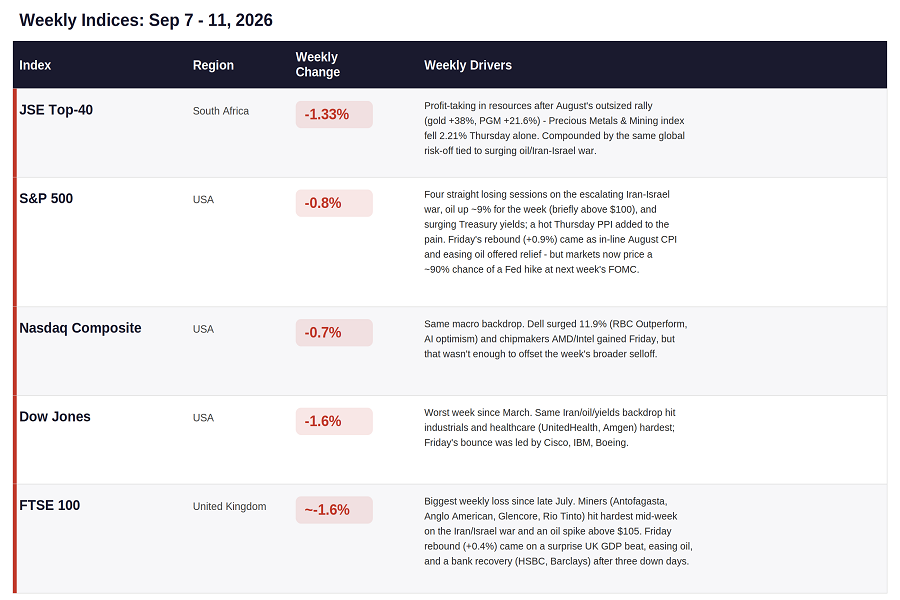
JSE Market – Week 2 of September.
While companies in the TOP-40 index and the broader mining sector faced pressure, firms in the energy and chemical sectors moved to the forefront, driven by the external geopolitical landscape.
Notably, Sasol (JSE: SOL) shares rose by 18% over the week, driven not only by global fuel shortages and rising prices but also by a rating upgrade from a Bank of America analyst. This upgrade was based on projected revenue growth that would enable debt reduction in the medium term. Further gains are anticipated as investors price in expectations of improved performance in Sasol’s upcoming financial report. Against this backdrop, the likelihood of resuming dividend payments has also increased.
Assets insulated from geopolitical tensions and currency fluctuations also drew attention this week, primarily due to the release of corporate earnings reports. Insurance provider OUTsurance Group (JSE: OUT) reported a strong period with growth in operating profit; the company also delighted investors by raising its dividend by 22% and declaring a special dividend of R1.178. OUTsurance SA saw its South African division’s operating profit surge by 78.2%, fully offsetting the weak performance of its Australian unit, Youi (down 44.9% due to natural disasters), and startup losses in the Irish division. In short, this generous dividend payout is directly underpinned by a specific, highly robust business segment.
The standout report of the week came from the transport and logistics firm Super Group (JSE: SPG), which posted a 26.6% increase in operating profit, a 36.0% rise in HEPS, and a 33.5% gain in pre-tax profit.
Even though this company among other activities transports coal and other extracted resources, currently facing market pressure, the profits previously generated from these operations remain intact; meanwhile, the state-owned Transnet continues to struggle to meet clients' requirements regarding delivery volumes and quality. Consequently, private logistics companies such as Super Group, remain the preferred choice.
UK Stock Market
This week, the UK stock market appeared to find a clear direction. The UK100 index declined amid growing expectations of central bank rate hikes, geopolitical factors, and rising oil prices. The latter leaving the mining sector with no chance of gains. Even strong UK GDP data for July and growth in the banking sector failed to salvage the situation. However, the market still saw rallies for companies that were largely insulated from and insensitive to the adverse backdrop.
Everplay Group (LSE: EVPL), a UK-based indie game publisher from Wakefield, saw its share price jump 27% following the successful launch of its new game, *Wardogs*, which sold a million copies in its opening days. The stock climbed for four consecutive days, initially driven by rumors and anticipation, and subsequently by the CEO’s official confirmation of the game's success.
Goodwin plc (LSE: GDWN) has not been quite so fortunate. This Stoke-on-Trent-based engineering firm, founded in 1883, remains under the control of the Goodwin family, who hold a stake of over 50%. While such family control typically commands respect and a valuation premium among investors, that was not the case here. The company operates in two main segments: Mechanical Engineering (castings, valves, antennas, and pumps - serving the defense, nuclear energy, and LNG sectors) and Refractory Engineering (powder production and mineral processing).
It was announced this week that Goodwin is selling its Mechanical Engineering business - comprising Goodwin Steel Castings, Goodwin International, Noreva, Easat Group, and the pump division to Cerberus Capital Management for a cash consideration of up to £1.1 billion. While share prices often surge on such news, the opposite occurred with Goodwin; the divested unit was the company's primary revenue generator and a profitable operation. For shareholders, the post-sale Goodwin represents a fundamentally different asset with a different valuation. A market re-rating began almost immediately. The situation is further complicated by uncertainty regarding whether Goodwin plans to distribute the proceeds to shareholders or retain the funds, given the family's controlling stake and authority over financial decisions.
Goodwin lost 32.45% over the week: the steepest decline among hundreds of companies, listed on LSE, excluding micro-caps.
US Market.
The US stock market was dominated by the escalating conflict between the US and Iran, as well as rising Treasury yields. With the probability of an interest rate hike climbing to 90%, it is hardly surprising that all major indices ended in the red. Yet, even in this environment, many companies are charting their own course on the market, garnering significant attention from investors and analysts alike. Frequency Electronics, Inc. (NASDAQ: FEIM) saw its stock price surge by 42.5% over the week. A manufacturer of high-precision frequency and timing systems for military satellites and GPS technology, the company released a financial report showing record revenue of $23.5 million—a 70% year-over-year increase and a 52% rise compared to the previous quarter. It also achieved a record order backlog, driven by strong growth in its two key markets - space and defense while simultaneously improving product margins. Investors responded enthusiastically with a buying spree, driving the stock price up by 42.5% for the week.
Solaris Energy Infrastructure (SEI) shares rose 22% on the New York Stock Exchange, driven by an upward revision of the company's forecasts. This is a classic case of a stock rising on expectations; the reason for this optimism becomes clear when looking at the company's recent activities - specifically, manufacturing equipment for data centers, the energy sector, oilfield services, and industrial clients. Even setting aside the revised future projections, the industry itself appears promising and profitable.
Which company delivered a negative surprise this week? ServiceTitan (NASDAQ: TTAN), which plunged 60.89% in a single week. The developer of software for trade-based businesses has recently been betting on "Max," an AI product featuring agentic automation capabilities. While this is a highly relevant and trending area, the company released a report this week revealing via the CFO, that growth in platform transaction volume (GTV) had slowed to 17% due to weak customer inflow during May and June. Simultaneously, the company announced the resignation of its Chief Sales Officer.
Investors reacted very negatively. Shares fell amid concerns that profits would decline due to weakening demand for the product. Management reshuffles failed to boost optimism. The company’s stock had already been falling for ten consecutive trading days, but the slide accelerated sharply following the release of the report. This case demonstrates that operating in a promising industry does not guarantee success; internal company dynamics and the product itself - which failed to generate sufficient interest among potential customers, also play a crucial role.
Stock indices technical review
JSE TOP-40
The South African index followed the global trend, falling another 1.33% for the second consecutive week as the mining sector dragged the index down.
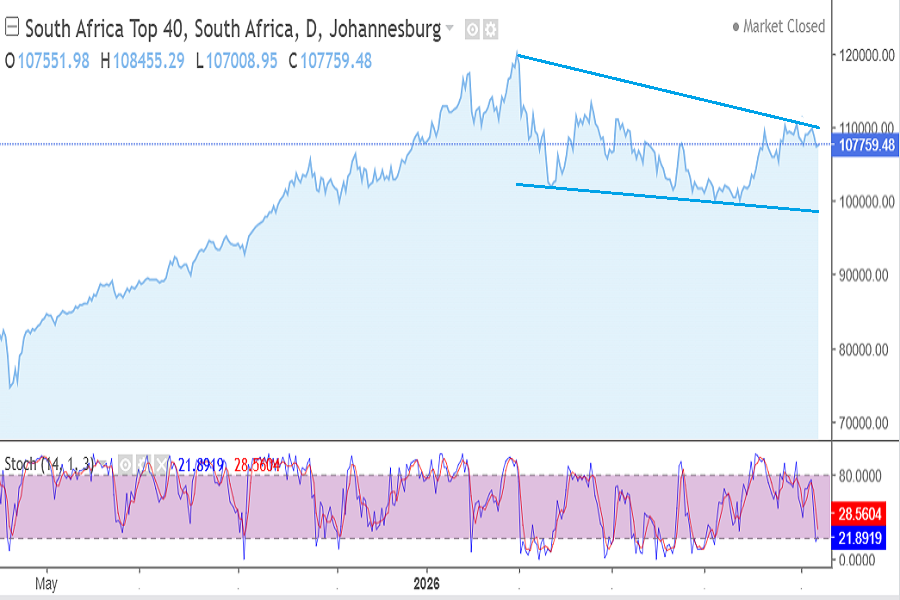
JSE TOP-40 chart September 2026 week-2
A trend reversal to the downside is becoming increasingly apparent on the chart. The resistance line is no longer shifting upward. The stochastic oscillator is pointing downward. Technical analysis indicators confirm our concerns regarding the high probability of a further decline in the index through the end of the year.
2. UK100 index
While the index was maximally neutral last week, things have changed this time around. It saw the sharpest decline among the indices, as well as its worst week since June 2026. Strong macroeconomic background in the UK didn't help.
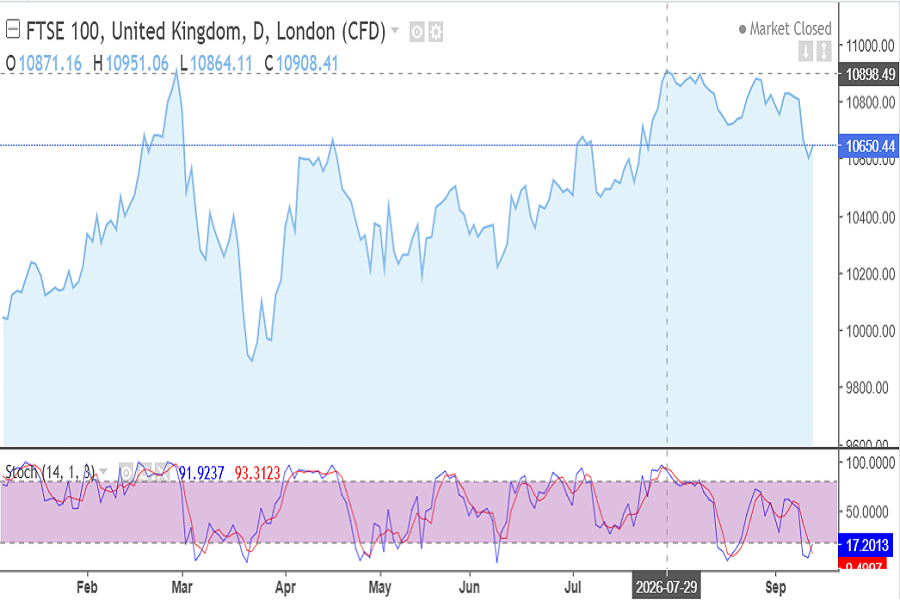
UK100 chart September 2026 week 2
The chart shows a loss of upward momentum over the past month. There are no signs of a reversal, yet the situation is becoming risky: the price correction is dragging on for too long.
Tech indicators show us Strong SELL signal and it seems true even if next week is positive for the index.
3. S&P index
US stock indices closed in the red—every single one of them. There is a 90% probability of monetary policy tightening; rising Treasury yields are drawing investors away from corporate equities. The outlook for the indices remains poor for the coming week if rumors of an interest rate hike materialize, while as for this week—you can see the situation for yourselves on the chart.
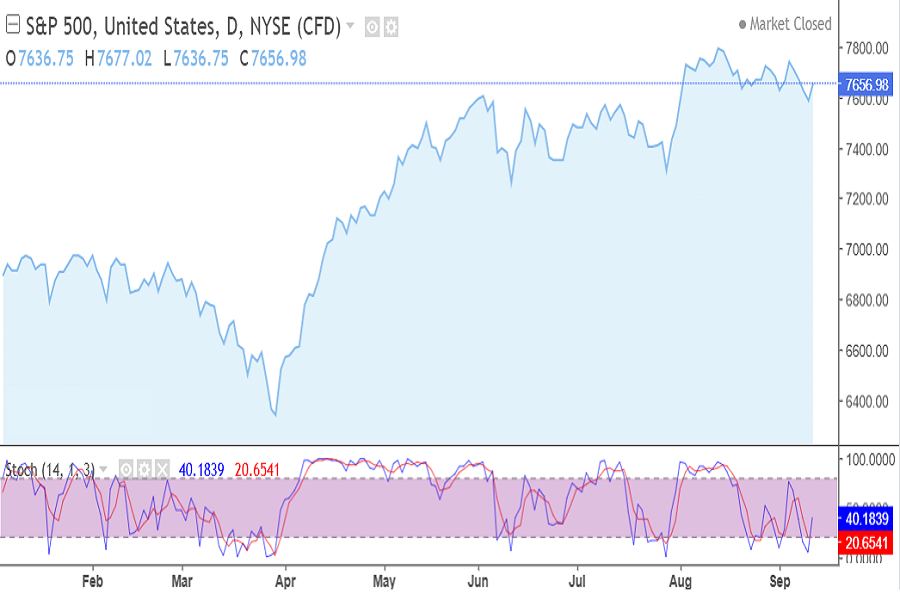
S&P500 index chart September 2026 week 2
There are signs of a downtrend forming. Each wave over the past few weeks has been lower than the previous one, even though the stochastic oscillator is pointing upward. To be honest, tech indicators are all mixed but we're more confident and expect for further decrease.
4. Dow Jones - US30 index
This index usually reacts to events in a restrained manner, but not this time. The worst week for Dow Jones index since March - means for the last 6 months.
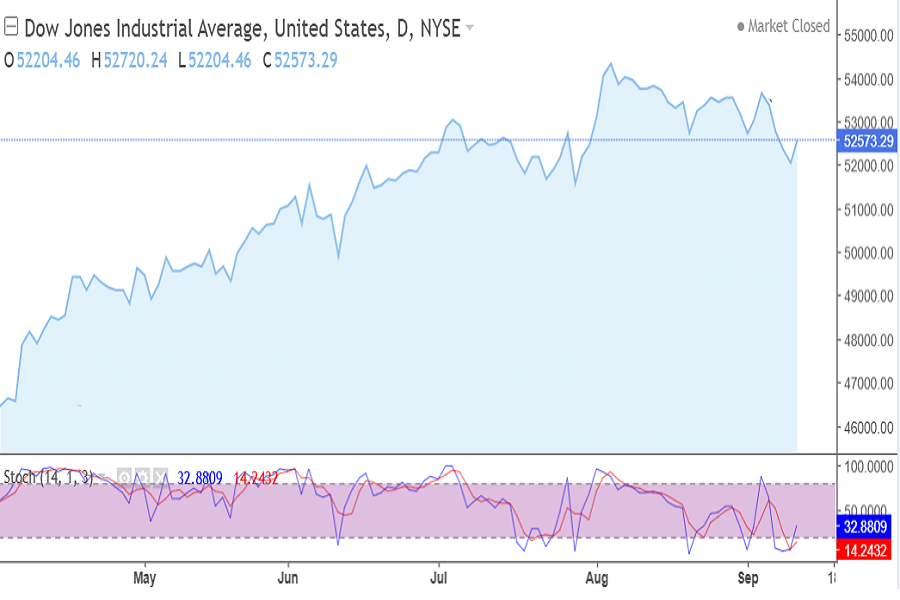
Dow Jones index (US30) September week 2
Here you can see that virtually all the indices are turning downwards. The chart shows the formation of a downtrend. Tech indicators confirm our Strong Sell signal.
5. NASDAQ Composite
Despite a strong rally by DELL, the index still dipped into negative territory, though it did not fall as sharply as other indices. It was a modest -0.7% decline, yet the chart still looks bearish.
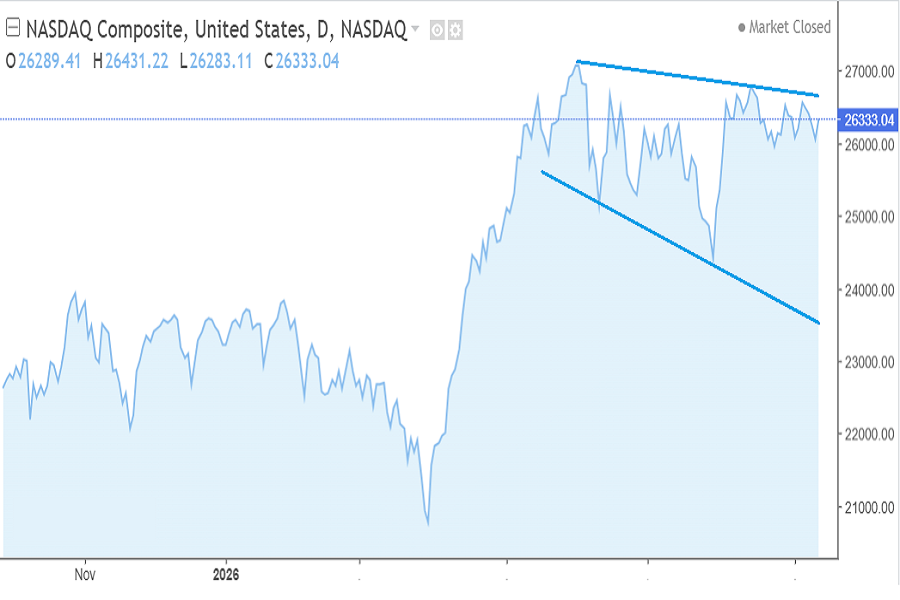
Nasdaq Composite chart, September 2026 week 2
Tech indicators show us mixed signals. The market is digesting the excessive growth before determining its direction. We don't believe this index will be different to others and has also a tend of moving down.
Key currencies this week
The week of September 7–11, 2026, was characterized by currency consolidation ahead of the September round of meetings by global central banks.
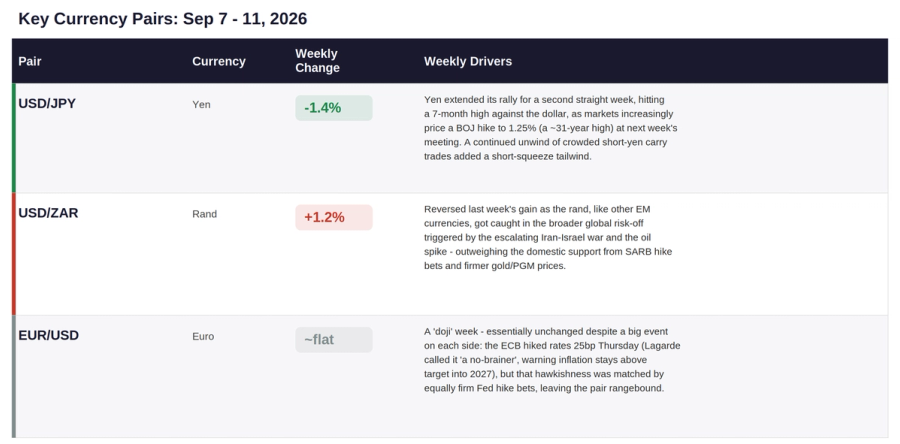
Comparison table
EUR/USD short review
The past week was dominated by decisions from the European Central Bank (ECB) and the release of key macroeconomic data from the US.
Key event: The ECB meeting on Thursday, September 10. The regulator raised its key interest rate (the deposit facility rate) by 25 basis points to 2.50% (with the rate on main refinancing operations rising to 2.65%) against the backdrop of upward revisions to inflation forecasts for 2026–2027.
Despite the ECB’s "hawkish" move, the euro failed to break out of its trading range. The dollar was supported by fresh US macroeconomic data (the US labor market demonstrated resilience, with employment figures exceeding forecasts). As a result, a balance of expectations has emerged: the market is simultaneously pricing in a hawkish stance from the ECB and a more restrained approach from the Federal Reserve ahead of the upcoming FOMC meeting.
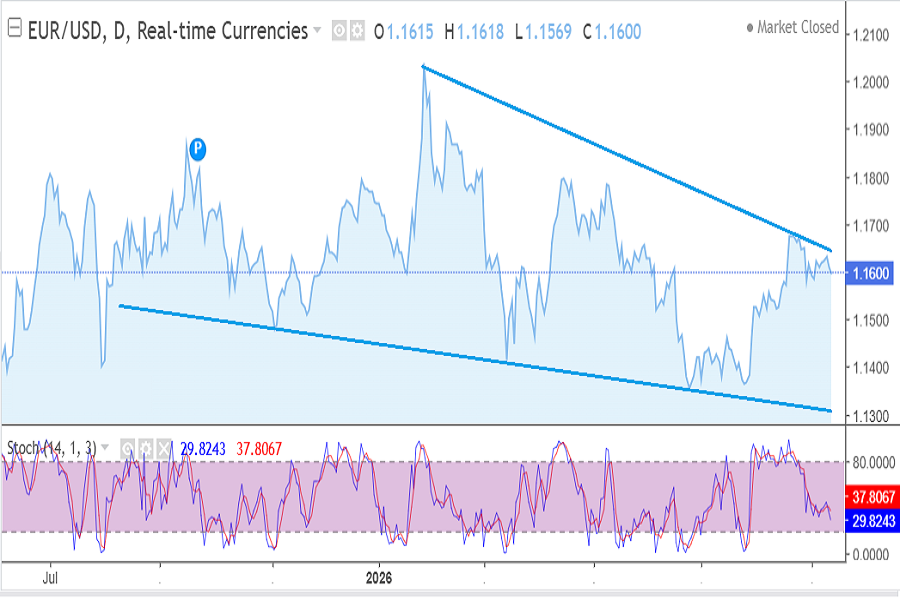
EUR/USD chart September 2026 week 2
The chart shows that prices are continuing within a weak, highly volatile downtrend. Despite the fact that the past week favored the EUR, the situation remains unchanged. There are no signs of a trend reversal.
Technical analysis indicators point to the effectiveness of sell trades, especially given that there is every reason to expect the dollar to strengthen next week.
USD/ZAR weekly review
The rand held onto its strong August gains, continuing to consolidate near multi-month highs. The pair stabilized in the 16.10–16.20 ZAR per dollar range (closing the week at around 16.12 ZAR).
Although the dollar may strengthen next week due to monetary policy tightening, the rand could find support through the end of the month on expectations of a similar move by the SARB.
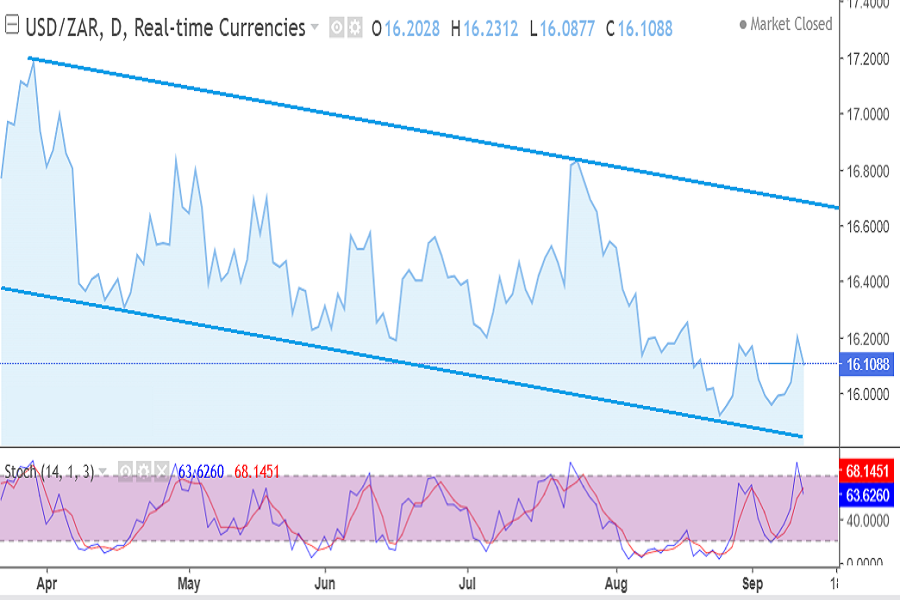
USD/ZAR chart September 2026 week 2
The chart shows a downtrend, and the situation remains unchanged for the rand, despite the decline in demand for risk assets. Perhaps currently we observe just a little price correction but no more. Technical analysis indicators are signaling a buy, but the upward move may be too limited to enter the market right now; however, over the coming week, the rand could indeed retreat against the dollar to the 16.20 levels.
USD/JPY weekly review
The USD/JPY pair showed a moderate decline (yen strengthening), retreating from local highs.
US 10-year Treasury yields saw no sharp swings over the week, depriving the US dollar of a key driver for gains against the yen. The yen also strengthened on speculation that the Bank of Japan (BoJ) is preparing further steps toward interest rate normalization, given persistent inflationary risks in the country.
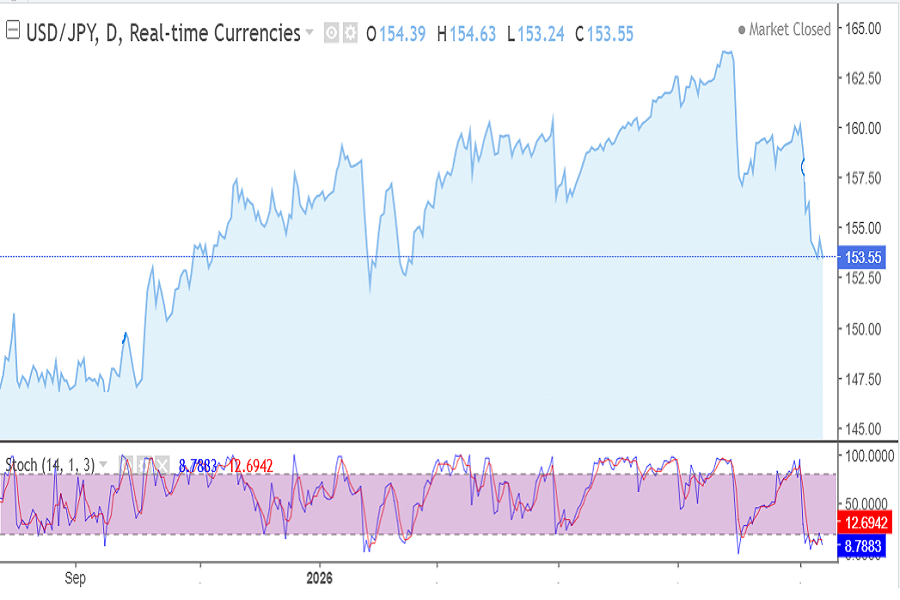
USD/JPY chart September 2026 week 2
The chart shows that the familiar undulating upward trend trajectory has been abruptly interrupted, and this appears to be more than just a standard price correction. It looks like prices have peaked. Technical analysis indicators are signaling a strong sell, and this seems plausible, though the dollar is likely to find support next week. We will only be able to find out in a few weeks whether the chart will turn fully downward.
Summary
Thus, we can conclude that the week in the stock markets was shaped by macroeconomic and geopolitical factors amidst declining demand for risk assets. Certain companies surprised the market with sharp drops and surges driven not only by financial results but also by external factors and internal corporate developments - elements that pose risks for investors.
The coming week may prove even more volatile, as the season of central bank meetings and macroeconomic data releases is just getting underway, while the end of the month will see a wave of corporate earnings reports. We hope this period brings you new achievements.

Stan Lytynsky
Stan Lytynsky is a well known financial expert with more than 1000 of market reviews. For the last 10 years he wrote reviews for different blogs and websites. In particular he worked for SuperForex and Zetradex forex brokers as a market analyst. Currently he is living in Canada and focused on the African market as the most promising and growing.
Comments
Loading comments…
Log in or sign up free to join the discussion.