USD/ZAR in October 2026. Fundamental review & forecast

John Nkosi
In early September, the rand was at its strongest of the year. The pair held below R16 per dollar, and R15.90 looked like a matter of time. Six weeks later, the picture has reversed. The rand has given back almost all of its summer gains. In the first week of October, the pair twice climbed to R16.70–16.74, the weakest rand since late July. The causes are the same ones that hit the JSE: a Fed rate hike, oil above $100 a barrel, a gold correction and record domestic fuel prices. The rand is now winning back part of its losses, but a dense run of key events lies ahead.
USD/ZAR today and a month ago
In mid-September, one dollar cost about R16.26. Today the pair trades near R16.49, so the dollar has gained roughly 1.4%. That number hides how much happened during the month. At the low, around 22 September, the pair dipped to R16.17. At the high, in early October, it reached R16.74. That is a swing of about 3.5%, which is a lot even for the rand.
The first blow came from the Fed. On 16 September, it raised its rate unanimously to 3.75–4.00%. The minutes of that meeting, published on 7 October, made the hawkish signal stronger: most committee members believe another hike before year-end will probably be needed. For emerging-market currencies this is direct pressure. Dollar yields rise, and the rate advantage that draws capital into the rand gets smaller.
The SARB responded on 23 September by raising the repo rate to 7.25%. The rand did not strengthen, because the market had already priced in the decision. The market now expects two more SARB hikes over the next six months.
The second factor is oil. On 7 October, Brent rose above $100 a barrel on Houthi attacks on Saudi Arabia and a storm threatening US oil regions. South Africa imports most of its fuel, so expensive oil means strong dollar demand from importers. ETM Analytics estimated that the rand lost about 3.5% in the month to 7 October, largely because of heavy diesel purchases. From 7 October, 95 petrol rose by R3.33 to a record R30.25 per litre.
The third factor is gold, the rand’s main export anchor. In late September, the metal dipped to about $4,297 an ounce, and the rand lost its usual support. Domestic data did not help either. The composite PMI fell to 49.0, which signals contraction, and mining output declined.
A turn started in recent days. On 13 October, the rand rose almost to its late-September level as the dollar softened and oil eased. For now, that bounce is driven by external forces, not by an improvement in South Africa’s own economy.
Forecast for Rand
The first event of the period has already happened. On 14 October, US September inflation came in hotter than expected: 3.7% year on year against a 3.6% forecast (3.4% in August), with core inflation at 2.6% against 2.5%. The dollar strengthened after the release and gold fell. This tilts the near-term risks against the rand.
Still ahead:
- 21 October: Finance Minister Godongwana presents the Medium-Term Budget Policy Statement (MTBPS).
- 28 October: the Fed’s decision. On 9 October, before the inflation data, the market priced the chance of an October hike at 16–18% and a hike by year-end at 75–85%.
- 4 November: South Africa’s local government elections.
Base case: a R16.35–16.70 range until the Fed decision. The market will avoid big bets before 28 October. After the hot US inflation print, the pair is more likely to drift towards the upper half of this range than the lower.
Rand-strengthening case: a move down to R16.20–16.30. This requires the Fed to signal on 28 October that it is not in a hurry for a second hike, oil to keep easing and the MTBPS to show no deterioration in the fiscal numbers. After the inflation data, this scenario has become harder to reach.
Rand-weakening case: a return to R16.70–16.75 and above. This becomes possible if the market starts pricing a Fed hike as early as October and Brent settles above $100 again. A break of the R16.74 zone would open the way to levels the rand has not traded at since the summer.
For reference, the Trading Economics model gives R16.36 by the end of the fourth quarter and R15.87 in 12 months. That is a model estimate, not an analyst consensus.
Technical analysis
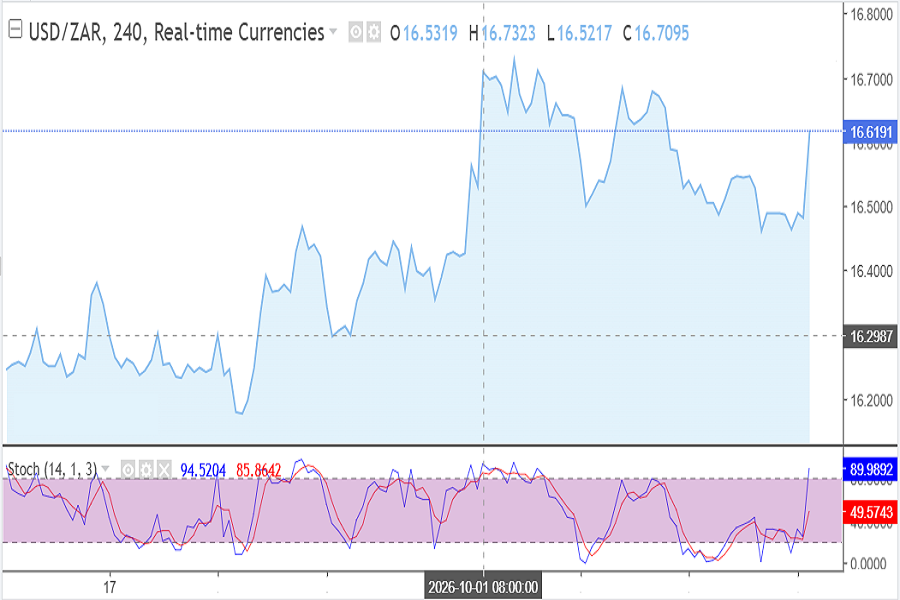
USD/ZAR H4 chart, October 2026
Since October, the rand has retreated slightly from the highs reached in September. While this could signal the end of a price correction and the resumption of a downward trend, technical analysis indicators are still flashing a buy signal. However, we would not place 100% trust in these indicators at this time. A new peak formed on October 6, indicating a loss of upward momentum. We anticipate the rand strengthening within the 16.10–16.65 range through the end of October.
Key levels:
- Support: R16.45 (local low), R16.35–16.40 (late-September base and lower edge of the gap), R16.07–16.20 (the month’s low).
- Resistance: R16.55–16.66 (the latest local high), R16.65, R16.70–16.74 (triple top).
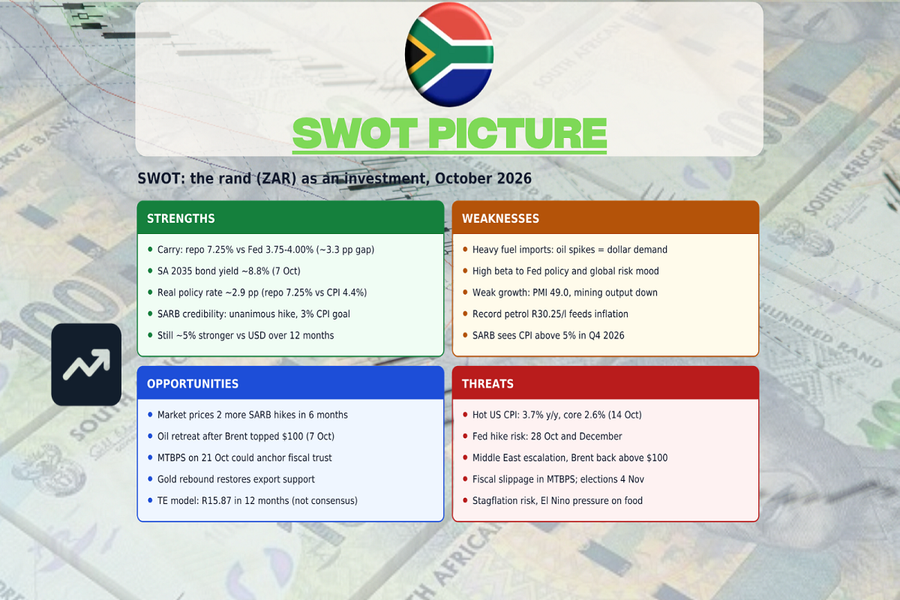
Swot picture of investments in ZAR in October 2026
Overall assessment
In October 2026, the rand is a high-yield, high-volatility instrument. Its fundamental strength is the rate gap: the investor is paid about 3.3 percentage points a year for holding it against the dollar. But the currency’s price is set by external forces such as the Fed, oil and gold, and right now all three are against it. A simple calculation shows the scale of the risk. The 1.4% the rand lost in a month equals roughly five months of carry income (3.3% ÷ 12 ≈ 0.28% a month). In other words, the carry pays for holding the rand but does not protect against sharp swings. This instrument suits an investor with a horizon beyond the coming cluster of events and a tolerance for monthly moves of 3–4%. It is not a defensive asset.
Bull case. On 28 October the Fed holds and signals no hurry for a second hike. Oil keeps easing and the MTBPS is credible. The pair breaks R16.40, fills the gap and heads to R16.20–16.30. A rand holder gains on both price and carry. In a calmer global environment, a return to R16.00 becomes a realistic target over several months.
Bear case. After the hot inflation print, the Fed hikes as early as 28 October. Brent returns above $100, and the MTBPS or the election campaign adds fiscal concerns. The pair breaks the R16.70–16.74 zone, and the rand moves to its weakest levels since summer. A move like that would wipe out several months of carry income within weeks.
Conclusion
Over the month, the rand completed a full cycle: from its yearly highs near R16, to its weakest level since July at R16.74, and back to R16.49. External forces drove the weakness: a hawkish Fed, expensive oil and a gold correction. External forces also drove the latest bounce: a softer dollar and cheaper oil. South Africa’s domestic economy is not helping. Activity is contracting, fuel is at a record price and the SARB has to keep raising rates. The rand remains a currency that reacts to global events rather than setting its own course. US inflation has already thrown the first punch, and it came hotter than expected. The budget and the Fed decision will now show whether the R16.70–16.74 zone becomes this autumn’s peak or just a stop along the way.

John Nkosi
John is from South Africa and know local financial market as it's own. He works directly for Stocktalk and responsible for making regular JSE market news.
Comments
Loading comments…
Log in or sign up free to join the discussion.