JSE & global markets on the first week of September 2026. Weekly review


The start of a new month usually brings new stories, new market movements, and new trends. Today, we'll find out if any changes occurred in the stock markets in early September? What signals can we spot to promptly open new profitable trades at a time when new trends typically begin to form?
The trading week that opened September was marked by localized fixing corrections and capital rotation. Markets digested the US Federal Reserve's rhetoric following the Jackson Hole symposium and assessed macroeconomic statistics. There was a clear contrast between cautious US markets, consolidating near all-time highs, and localized correction in South Africa and emerging markets.
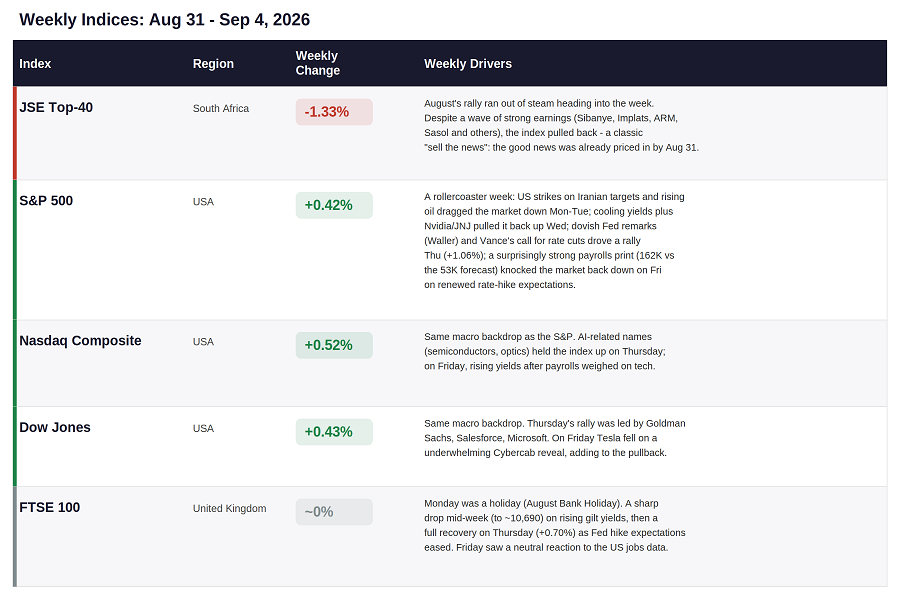
stock indices comparison
On the table you can see that most of stock markets was almost frozen on early achieved levels. South Africa was the only exception: here you you can see a solid bearish movement. We will review each in details below.
South Afican stock market
On the background, saturated with strong corporate reports, we observed quite positive trading days with high volatility. At the same time, there's no solid rallies, epic fails within a week. Investors reacted on financial reports quite cold as it was last week.
The strongest financial report was published by Impala Platinum (JSE: IMP). Platinum miner reported this week that their headline earnings increased by 31 times, revenue - by +58% and declared increase in dividends. Shares as a result of the week increased by 7.8%. The effect of both higher dollar prices for platinum group metals and the strengthening of the rand. The company also recorded a reversal of impairment charges of R11.1 billion (R8.1 billion after tax), primarily related to the Impala Rustenburg production assets. Net profit was R31.7 billion, compared to R707 million a year earlier.
The most impressive develop with dividends show Motus Holdings (JSE: MTH): reported its financial year 2026 results (the year ending June 30) on September 2. Profit before tax reached R4 billion - the highest in over three years (+20%). Profit attributable to shareholders increased by 19% to R3 billion, EPS by 19% to R17.53, and HEPS by 15%. The board of directors increased the dividend payout ratio to 40% of HEPS, resulting in a 29% increase in the total dividend for the year to R7.10 per share.
Why the result was so strong? Growth was broad-based across all divisions. In the South African automotive market, new car sales are rebounding amid falling interest rates and an influx of new players (primarily Chinese brands), narrowing the affordability gap for buyers. The after-sales auto parts business saw a particular surge, with profits nearly doubling thanks to expansion into a previously underserved informal. Additionally, strict capital discipline is in place: M&A transactions have virtually ceased, and the company is focusing on cash flow generation (+27% available cash) and debt reduction.
UK stock market in early September
LSE had a cut trading week - 4 trading days only. This negatively impacted on volatility. Stock rally won Irish company while British business got stuck. We would admit Cairn Homes as winner of british stock market this week by excluding microcaps. On the background of thin market their stocks added +15%. Ireland's largest residential developer, primarily focused on the Irish primary housing market, has released its financial results and impressed investors with strong performance. First-half revenue grew by 60%, sales by 61%. Operating profit increased by 75%. The company raised its interim dividend by 10% (to 4.5 cents) and launched a new €50 million buyback program (valid until September 2027). Investors bought shares all week, responding to the recovery in the Irish property market.
US stock market in early September
After a strong close in August, the US trading week began with profit-taking. The main pressure factors were geopolitical tensions in the Middle East, a localized pullback in the tech sector, and the digestion of the Fed Chairman's rhetoric on fighting inflation.
The most dramatic story with happy end for investors was observed on Nasdaq. GoPro Inc, well known camera's manufacturer which had been teetering on the brink of bankruptcy and delisting for a long time, as its share price fell below the acceptable level of $1 became the most incredible event on the stock exchange. This week, the company's shares soared 178.6% in just a few days. How was this possible?
On Tuesday, September 1st GoPro announced a binding merger agreement with Starman Optical, a privately held American manufacturer of optical transceivers for AI data centers (founded in 2024). According to the deal GoPro shareholders will receive a combined $285 million in cash, or $1.14 per share, while retaining approximately 10% of the combined company. The combined entity will remain on the Nasdaq and will focus on AI infrastructure, government, defense, and aerospace markets, while continuing its regular camera business. Closing is expected by the end of 2026, subject to shareholder and regulatory approval. The stock jumped another 78-85% intraday on this news, just returning above the $1 delisting threshold.
On NYSE the most exciting growth was done with CNH Industrial (NYSE: CNH). This stock added in price 22%. The global manufacturer of agricultural and construction equipment, under the New Holland and Case IH brands, originally from the Netherlands, has gained the attention of investors due to a reassessment of the entire agricultural sector and forecasts of increased demand for agricultural equipment in the future.
Stock indices technical review
JSE TOP-40 index overview
The JSE TOP-40 index has been living its own life this week – not only from South African investors and the strong earnings environment, but even from the other indices - both British and American, demonstrating a decisive bearish stance, while others are hanging in indecision, consolidating in the green zone, around zero.
On the technical point of view you can consider this decrease as a price correction.
The South African JSE TOP-40 index entered a planned technical correction after breaking August highs (~111,000+ points on August 28).
- Profit-taking in commodities: A pause in the precious metals rally and a pullback in mining giants (Sibanye-Stillwater, Anglo American).
- Rand (ZAR): The USD/ZAR pair consolidated around R16.15–16.20, halting the bullish momentum in the local financial sector.
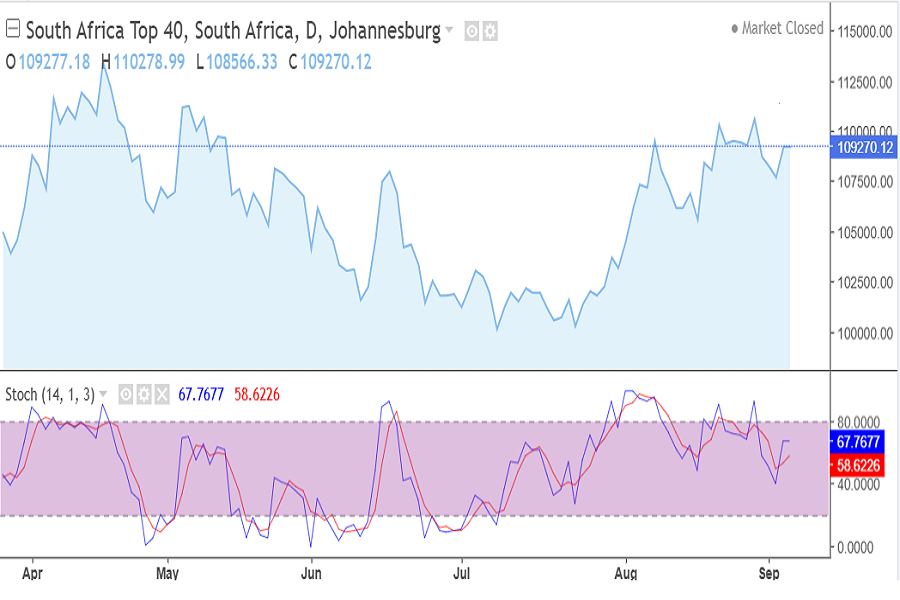
JSE TOP-40 index chart, September 2026
Despite lost of upward momentum, tech indicators show us confidend strong BUY signal, no oversold or overbought zone. Being near historical highs, it's likely that stocks are preparing for another upward surge. A positive sign is that the trend hasn't reversed completely after reaching its peak. This means the battle to reach new heights is not yet over.
2. UK100 index overview
During the week, the stock exchange saw pressure from energy companies amid fluctuating oil prices, as well as subdued investor demand for European risk ahead of regulatory meetings. A lost trading day on the stock exchange was also one of the reasons for the low volatility. The index ended the week practically at the same levels it began—complete consolidation and "Hold" position.
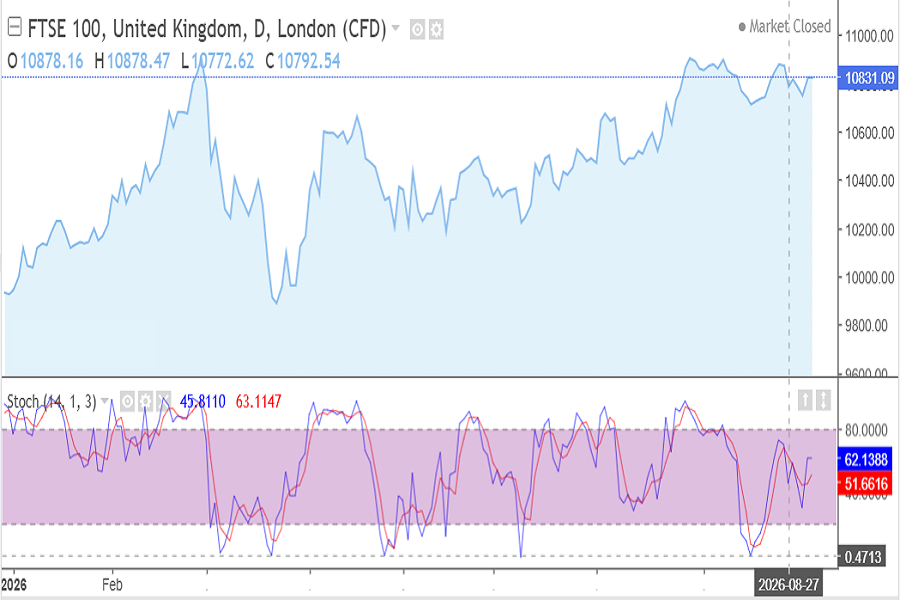
UK100 index chart, September 2026
Being very close to the highs, quotes inevitably found themselves in a consolidation phase and are waiting for new impulses to resume the upward movement.
Technical indicators confirm potential of growth with strong buy signals.
3. Dow Jones index overview
The industrial giants index was influenced by financial institutions and retailers, demonstrating a neutral-mixed trend with strong support levels remaining.
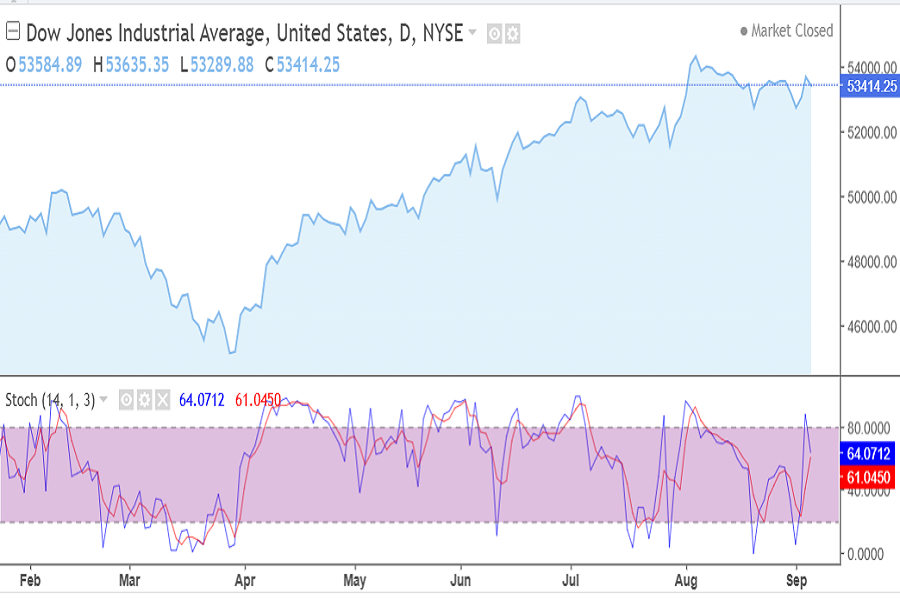
Dow Jones US30 index September 2026
Although the chart is similar to the others, there are a number of differences, namely a clearly visible sideways trend. Of the 30 companies, 17 ended the week in the red. That is around 50/50. So a weak growth is obviuos. There has been no upward momentum for over two weeks. Chances of a recovery in the uptrend remain in the medium term. Technical analysis indicators are also optimistic.
4. S&P500 index
The S&P 500 hovered near 7,718.60 pts, while the US30 consolidated within its established range.
Investors stayed on the sidelines awaiting labor market indicators (JOLTS and NFP) to gauge the Federal Reserve’s interest rate path ahead of the September FOMC meeting.
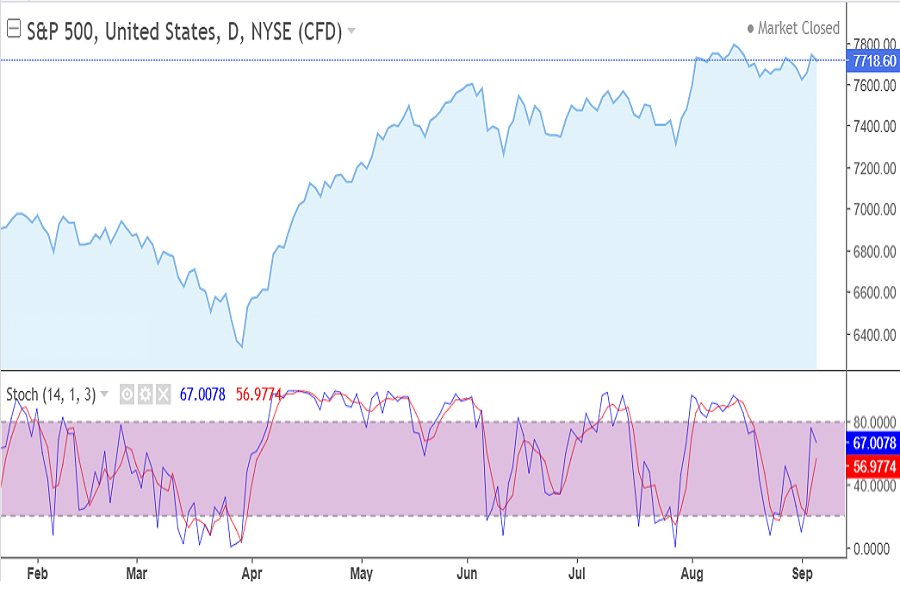
S&P500 index chart, September 2026
Close to zero movement means - nothing new here. Tech indicators also show us Buy signal. We admit that the higher rates - the harder movement upward.
Key drivers is a SanDisc with 17% rally this week with the same factors - memory deficit on the market and high demand on the side of AI infrastructure.
The main fall was done with The Edison International (NYSE: EIX) - a major American public utility holding company. Their stocks down by 23% due to a legislative setback in California regarding wildfire liability protections, combined with a wave of Wall Street analyst downgrades.
5. Nasdaq Composite
Mega-Cap Tech experienced systematic profit-taking. High equity valuation multiples (P/E ratios exceeding 30x forward earnings) proved vulnerable in an environment where 10-year Treasury yields sit at ~4.72%.
The index's biggest decline was the plunge in shares of a pharmaceutical company Ultragenyx Pharmaceutical Inc. (NASDAQ: RARE), which announced the failure of a trial of its innovative drug for treating Angelman syndrome. Analysts responded with rating downgrades, and investors sold off the stoc, that closed week with 64% decrease. however on the green zone they had mentioned above GoPro shares increased by 178%. And as a result index changed by 0.4-0.5% for the week.
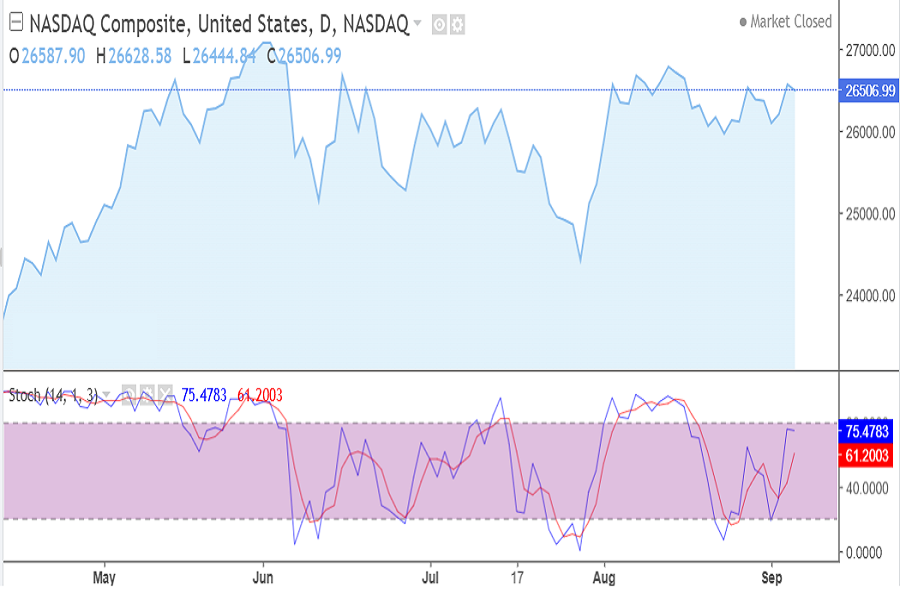
Nasdaq Composite index September 2026
On the chart we have the same for US indices sitiation: consolidation stage and promising perspective according to tech indicators.
Key currencies overview
The first week of September 2026 marked heightened volatility and reactions to US macroeconomic data on the Forex market. The key event of the week was the release of the US Non-Farm Payrolls report for August. Against the backdrop of mixed performance in the US Dollar Index (DXY), which traded in the 99.10–99.36 range, key currency pairs demonstrated mixed movements, a combination of technical consolidation and localized momentum.
EUR/USD weekly overview
EUR/USD can be considered the calmest currency pair of the week. Both the euro and the dollar competed equally, and macroeconomic reports failed to clarify which was stronger and better for investors. The result was a change of only 0.3% over the week, in favor of EUR.
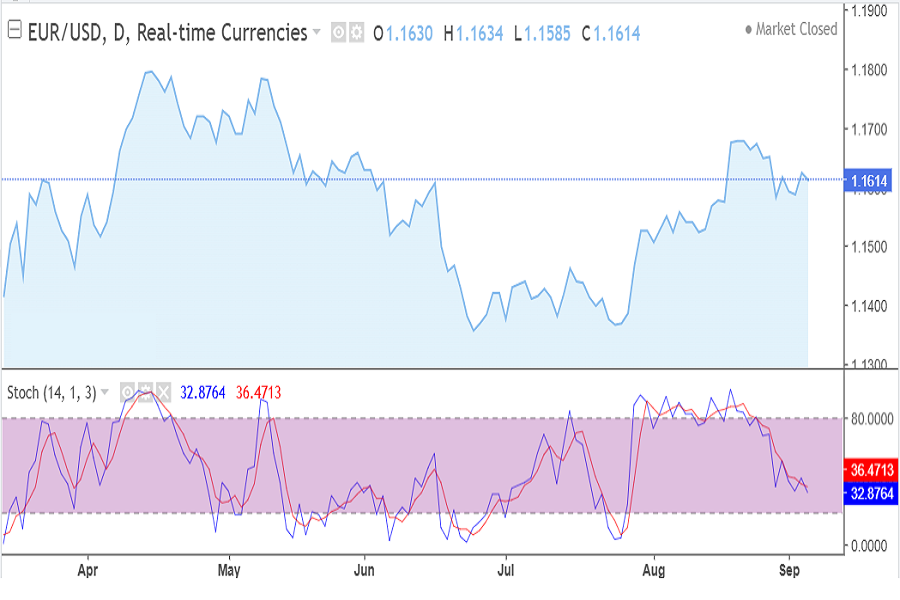
EUR/USD chart September 2026 week 1
The rates continue within upward trend despite a weak momentum. Tech indicators mainly forwarded upward, showing us Buy signal. We believe it's quite real and after the price correction. all chances to continue rally.
2. USD/ZAR weekly digest
The rand strengthened by 1%, approaching its highest since the start of the Iranian conflict in February. Rising gold and platinum group metals prices supported the rand, plus growing expectations for a 25 pips SARB rate hike at the September 23 meeting to curb inflation from the oil shock.
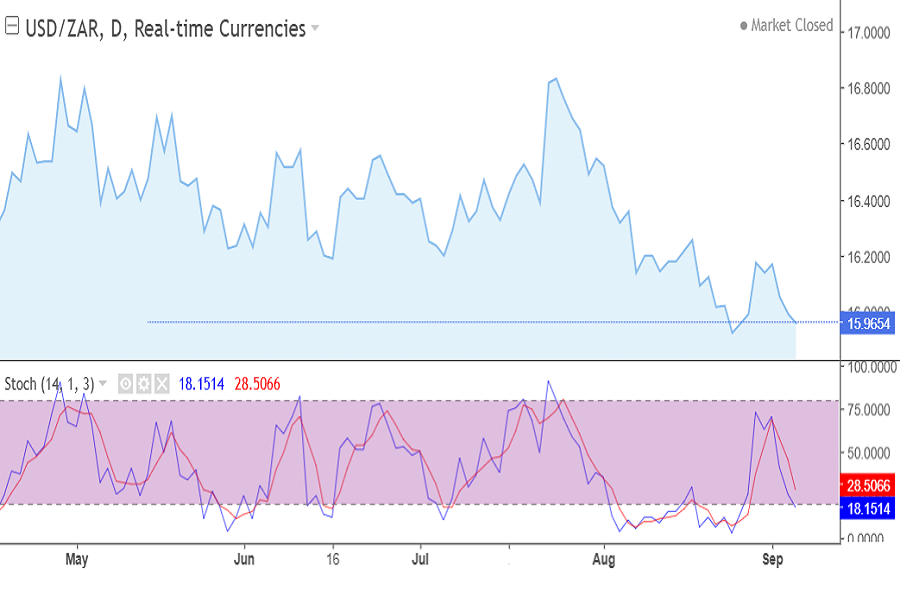
USD/ZAR chart September 2026 week 1
Here we have downward trend and unlimited potential given that this currency pair used to have lower levels 5 years before. Tech indicators confirm this with a strong Sell signal.
3. USD/JPY weekly review
Here is undisputed leader of the movement among the majors, the largest weekly decline (outside of intervention periods) since February. A story in two acts: first, the Iranian factor (reports of an Iranian strike on a US base in Kuwait) pushed the dollar higher as a safe-haven asset, sending the pair soaring to 160.40; then, the rhetoric of the Bank of Japan (board member Takehiro Takada and Governor Ueda allowed for a rate hike as early as this month due to inflation risks) triggered a sharp unwinding of record short positions on the yen, and the pair plummeted to ~155.5-156.2.
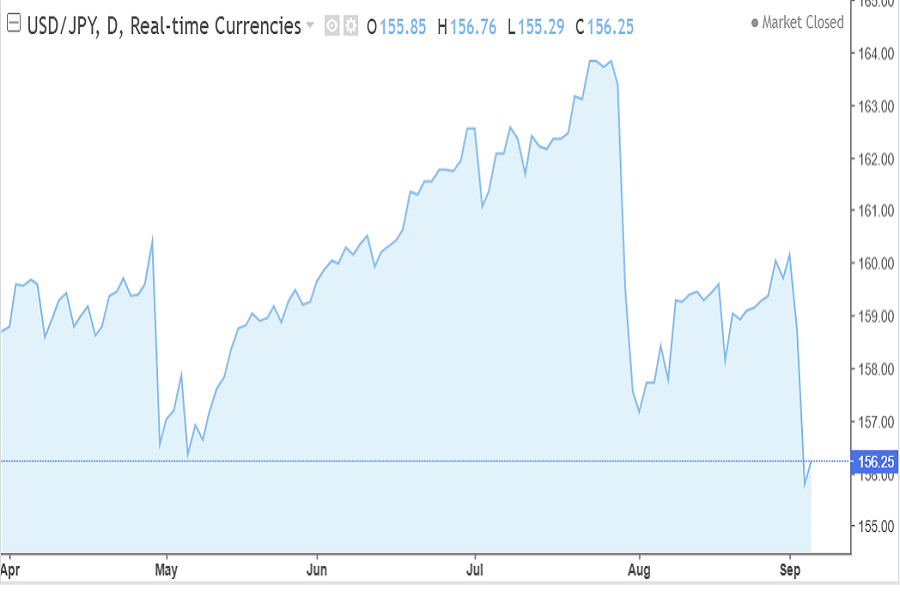
USD/JPY chart, September 2026 week1
It's also the most predictable currency pair. As we expected last week soon we will have new step down and here we have it. Further we will likely to have a price correction. Tech indicators show us Strong Sell signal and it's tru but in the long term only, with very possible drawdowns.
Summary
Thus, we see that the week has been one of consolidation, with markets awaiting new signals to determine direction. Only the South African market was decisive, entering a price correction despite positive signals from the mining sector. Meanwhile, despite the consolidation of indices, we saw impressive rallies of up to 178% in some world-famous companies in the US market, as well as devastating declines. This means that zero volatility in indices does not mean zero gains or losses for individual companies you invest in and personally for you.

Stan Lytynsky
Stan Lytynsky is a well known financial expert with more than 1000 of market reviews. For the last 10 years he wrote reviews for different blogs and websites. In particular he worked for SuperForex and Zetradex forex brokers as a market analyst. Currently he is living in Canada and focused on the African market as the most promising and growing.
Comments
Loading comments…
Log in or sign up free to join the discussion.